IPNetwork Monitor
IPNetwork Monitor provides continuous monitoring of your company’s critical network services and resources. Unlike many monitoring tools, IPNetwork Monitor checks not only the availability of a resource but also its operability and performance characteristics.
The core element in IPNetwork Monitor is a monitor. It checks the availability of a service on a local or remote computer and requests a specific parameter value. Each monitor has configurable parameters that determine:
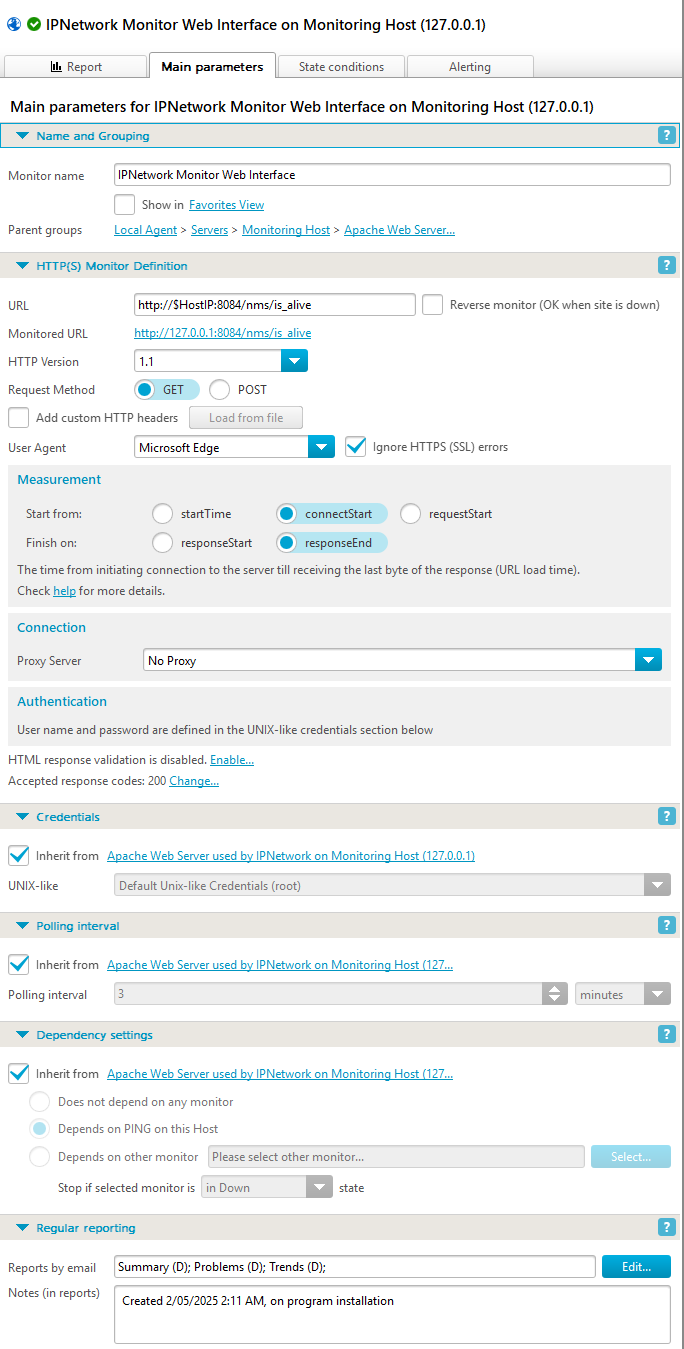
- Monitor name
- Monitor definition (what and how to check – monitoring parameters)
- Polling interval
- Dependency settings: Should the monitor change its state based on another monitor’s state?
- Report types and frequency
You can define the conditions that trigger a state change on the State conditions tab. You can also specify the alerts the monitoring service should send when a monitor changes state or an event occurs.
Organizing Monitors into Groups
Grouping monitors by host type and monitor type simplifies managing your monitoring system. For example, you can create a host group for each location and organize your hosts (servers) accordingly.
Available Monitor Types
| SNMP | Standard method for retrieving management information and performance data from Unix/Linux servers, Windows servers, networking equipment, and other devices. 70 common MIBs are included. |
| PING | Sends a standard PING to the server/device. |
| TCP | Checks if the server accepts connections on a specified port. |
| UDP | Performs UDP datagram send/receive operations on a specific port. |
| SMTP | Checks an SMTP server with optional authentication and sends a test message. |
| POP3 | Checks a POP3 server with optional authentication. |
| IMAP | Checks an IMAP server with optional authentication. |
| HTTP/HTTPS | Performs GET or POST HTTP/HTTPS requests with optional content validation. |
| Web Transaction Monitor | Simulates the actions of a real user interacting with a web application or e-commerce site. You can check web application availability and performance. |
| FTP | Checks an FTP server with optional authentication. |
| DNS | Monitors a DNS server. |
| WMI CPU load | Checks the current CPU load on a remote computer via WMI. |
| WMI Available Memory | Checks the current amount of available memory on a remote computer via WMI. |
| WMI Bytes Received/sec | Checks the current inbound throughput on a remote computer. |
| WMI Bytes Send/sec | Checks the current outbound throughput on a remote computer. |
| WMI Custom (run WMI script) | Runs a custom WMI script to check a specific value on a remote computer. |
| DISKSPACE | Monitors the free disk space of a local disk drive or a remote network share. |
| FILE | Monitors a file on a local disk drive or network share. It checks if the file exists and if the file size is within a given range. |
| Windows Service | Monitors the presence of any Windows service on the local machine or a computer in the network. You can restart the service using the Run program action. |
| ODBC Database | Checks an ODBC data source for availability with optional authentication and SQL expression execution. You can use it to monitor Oracle, MS SQL server and other databases. |
| Oracle Database | Checks an Oracle database for availability with optional authentication and SQL expression execution. |
| MySQL Database | Checks a MySQL database for availability with optional authentication and SQL expression execution. Secure connection support is also available, which is especially important when monitoring hosted databases. |
| MS SQL Database | Checks an MS SQL database for availability with optional authentication and SQL expression execution. |
| WMI Traffic Speed | Calculates incoming, outgoing, or total traffic speed (average for a polling interval) on the specified network interface using data provided by the target host’s WMI service. |
| WMI Traffic Volume | Calculates incoming, outgoing, or total traffic volume on the specified network interface for a specified timeframe using data provided by the target host’s WMI service. |
| SNMP Traffic Speed | Calculates incoming, outgoing, or total traffic speed (average for a polling interval) on the specified network interface using data provided by the target host’s SNMP service. |
| SNMP Traffic Volume | Calculates incoming, outgoing, or total traffic volume on the specified network interface for a specified timeframe using data provided by the target host’s SNMP service. |
| Script or Program | Easily create custom monitors. Scripts and programs are supported. You can use Nagios plugins. |
| SSH (Remote Script or Program) | Allows you to run commands on other computers over SSH and integrate IPNetwork Monitor with other systems deployed remotely. |
| SNMP Generic Trap | Listens for SNMP v1 / v2c traps sent by SNMP-enabled devices such as routers. |
| SNMP Custom | Monitors SNMP v1 / v2c / v3 performance counters such as network traffic or system resources on any SNMP-enabled device. |
| SNMP CPU | Measures CPU usage parameters (total, user time, system time, and other parameters) using data provided by the SNMP agent on the target host. |
| SNMP Memory | Measures memory usage parameters (free, used for either physical memory or swap space) using data provided by the SNMP agent on the target host. |
| SNMP Disk space | Measures free or used disk space for a specified filesystem using data provided by the SNMP agent on the target host. |
| SNMP Process | Shows various parameters (number of processes, CPU and memory usage) of a specified process using data provided by the SNMP agent on the target host. |
| SSH CPU | Measures CPU usage parameters using data provided by an SSH script running on the target host. |
| SSH Memory | Measures memory usage parameters using data provided by an SSH script running on the target host. |
| SSH Disk space | Measures free or used disk space for a specified filesystem using data provided by an SSH script running on the target host. |
| SSH Process | Shows various parameters of a specified process using data provided by an SSH script running on the target host. |
| WMI CPU | Measures CPU usage parameters using data provided by the WMI service on the target host. |
| WMI Memory | Measures memory usage parameters using data provided by the WMI service on the target host. |
| WMI Disk space | Measures free or used disk space for a specified filesystem using data provided by the WMI service on the target host. Note: Unlike the generic Disk space monitor, this monitor does not require the monitored filesystem to be a network shared resource. |
| WMI Process | Shows various parameters (number of processes, CPU and memory usage) of a specified process using data provided by the WMI service on the target host. |
| WMI Uptime | Shows target host uptime in days according to data provided by the WMI service. |
| Windows Event Log | Monitors number of events added to the event log for selected period. |
| Syslog monitor | Receives syslog messages from network devices, Linux/Unix servers, and other syslog-enabled systems. |
| Python script | Runs a Python script that returns either performance value or an error message. |
Polling
Monitors are polled (checked) at regular intervals defined by the user. By default, ‘Basic connectivity’ monitors are checked every 30 seconds, all others every minute. The minimum interval between polls is 1 second, but it is not recommended to use a polling interval less than 15 seconds. More frequent checks are practically useless, and they can degrade network performance, which contradicts the goal of monitoring. The result of a check is either a value or an error message. Depending on the returned value, the monitor stays in the OK state or transitions to one of two problem states:
- Performance Warning
- Down
IPNetwork Monitor reacts to monitor state changes by performing alerts assigned by the user to the corresponding state. Alerts are configured in Alerting Rules.
Dependencies

You can make a monitor dependent on the state of another monitor. This means the dependent monitor is checked only if the monitor it depends on is in a state other than Down, Stopped, or Stopped by Dependency. For example, you can make all monitors in a subnet dependent on a PING monitor to the gateway of that subnet. By default, a monitor inherits its dependency setting from its parent host; the default dependency is the PING monitor on its parent host.
Admin Tools
IPNetwork Monitor provides interfaces to manage your hosts (servers) directly from the client GUI. These include:
- SSH client
- Telnet client
- Remote Desktop client
You can configure these interfaces on the Settings-> Admin Tools page. You can also specify a path to the device’s web interface on the host’s Main parameters tab.
Other features description:
| Network Discovery | Helps you create a basis for your monitoring configuration and automates the task of detecting network hosts and network services. |
| Alerting Features | Here you can find a list of alert types (ways of reacting to problems that occur during monitoring) available in IPNetwork Monitor and their brief descriptions. |
| Reporting Features | Here you can find a list of report types available in IPNetwork Monitor with brief descriptions. |
| IPNetwork Monitor interfaces and structure | Here you can find an overview of IPNetwork Monitor components, Windows and web interfaces. |