System Monitoring User Interface
The IPNetwork Monitor’s user interface comprises two components:
A monitoring application (Windows UI) that enables you to view and modify the monitoring system’s settings, and to access reports, graphs, and logs.
A web interface (Web UI) that allows you to monitor the current status of resources, along with reports and graphs displaying monitoring data for any time period, accessible from any web-enabled device (e.g., any device with a web browser).
GUI Application Overview
The IPNetwork Monitor Windows interface (also known as the client GUI) empowers you to initiate, halt, and customize network monitoring, retrieve and examine monitoring outcomes, and receive notifications about state changes.
The IPNetwork Monitor client GUI presents all monitoring configuration options, availability and performance monitoring results, and logs within a single screen. This consolidated approach is designed for efficiency. Typically, after adjusting settings, you anticipate observing the impact of those changes on monitoring outcomes. Conversely, if you identify a problem within the monitoring results, you might wish to fine-tune the monitoring parameters or associated actions.
The GUI incorporates three viewing panes, in addition to the standard Windows menu, toolbar, and status bar. 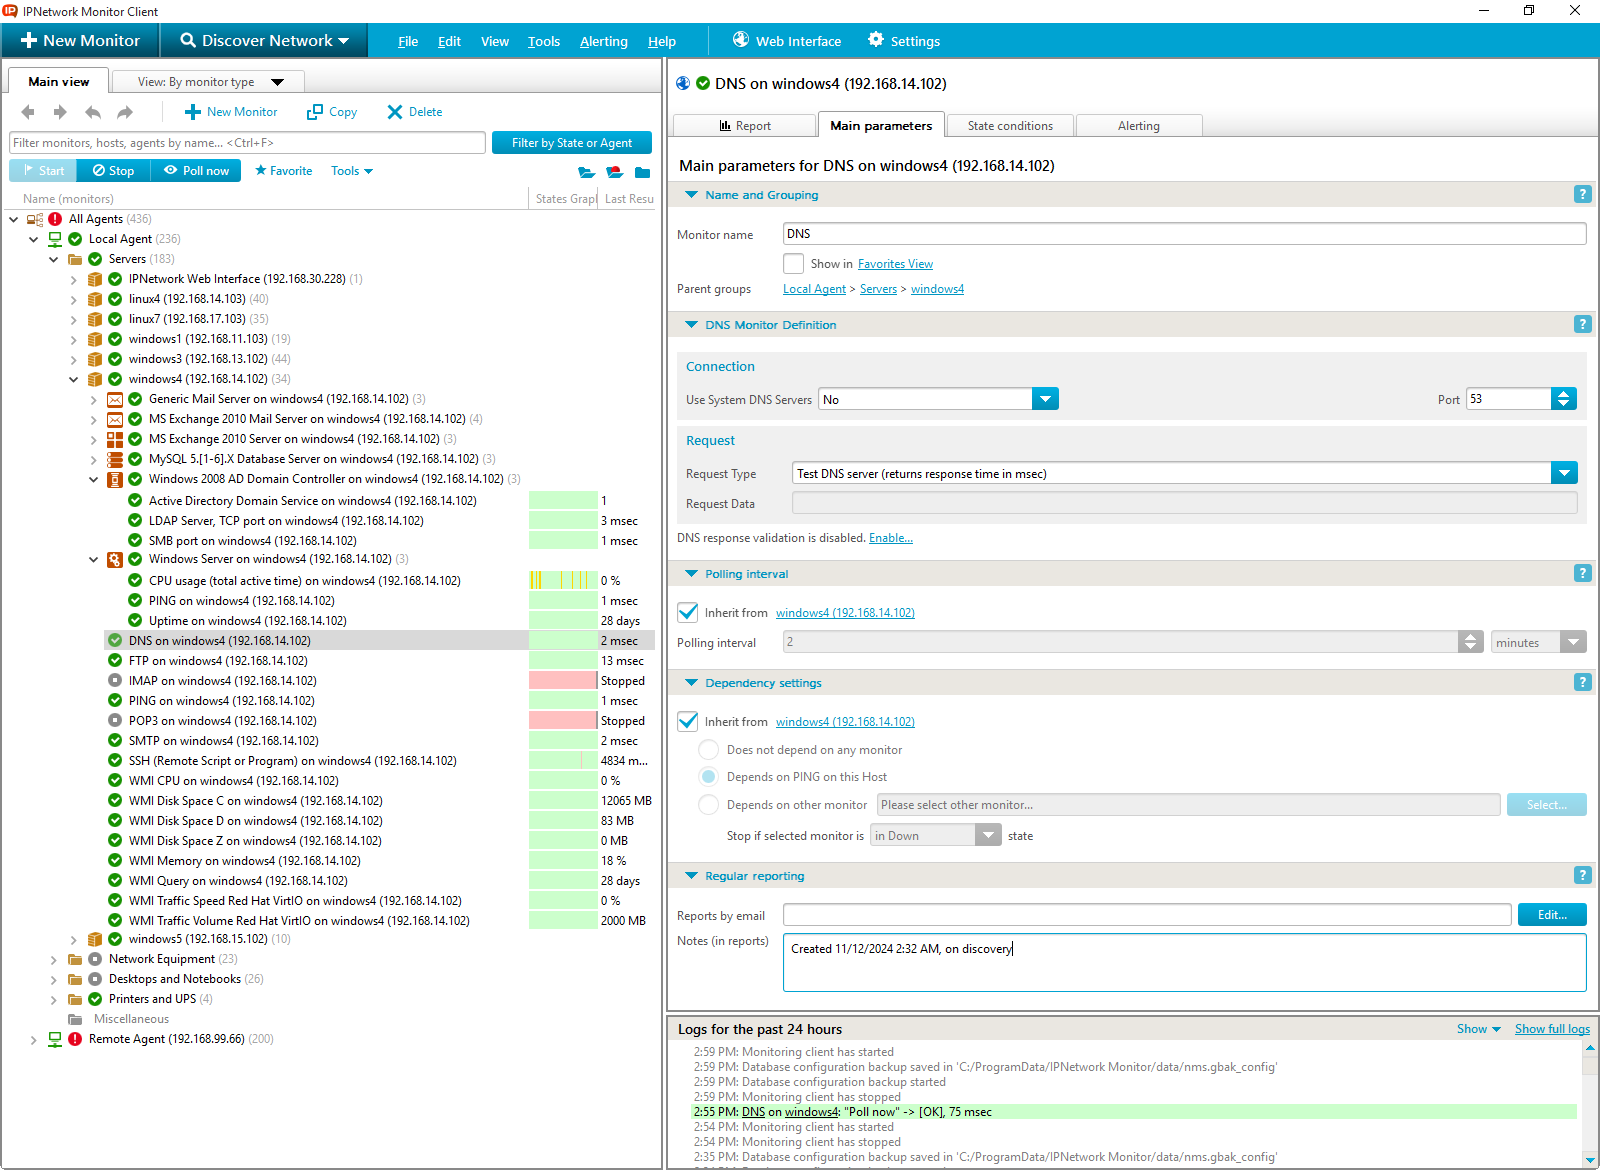
The Windows GUI is composed of three panes:
- Tree View Pane
- Parameters/Results Pane
- Logs Pane
The Client GUI places an icon in the system tray. This icon persists even when the main GUI window is closed; double-clicking it restores the client GUI. A running monitoring service is indicated by the icon displaying the most severe monitor status within your system. When the monitoring service is stopped, the icon appears grayed out. Hovering the mouse cursor over the tray icon displays a summary tooltip of your monitoring system’s status.

While minimized to the system tray, the client GUI uses tray balloons to signal significant system occurrences, such as starting or stopping the monitoring service. A configured Pop-up window alert for a monitor also triggers a tray balloon notification.

Tree View Pane
The Tree View pane offers multiple perspectives of monitored entities, facilitating a quick overview of the monitoring system’s health. By default, the Tree View pane displays the By Host tree. A drop-down menu provides access to By Monitor Type, By State, Discovered, and Favorites views.

Each tree node’s icon reflects the worst status among its child monitors. Shifting focus within the Tree View refreshes the content of the other client panes. Commonly used functions are accessible through the Tree View’s context menu, which is displayed by right-clicking a selected monitor or group.

Parameters/Results Pane
 The Parameters/Results pane serves for configuring monitoring parameters. It displays all settings associated with the currently selected object. Configuration options such as monitor name, comments, polling frequency, monitor-specific parameters, availability settings (like timeout), monitor performance thresholds, and actions triggered by state changes, are accessible via tabs within the Parameters/Results pane: Main parameters, State conditions, and Alerting.
For monitor groups, this pane also presents a summarized status overview of the monitors within the group.
IPNetwork Monitor integrates with several administrative tools through dedicated interfaces, streamlining server management directly from the GUI client. These interfaces are configurable on the Settings -> Admin Tools page. Available tools include:
- Remote Desktop client
- SSH client
- Telnet client
The URL for a device’s web interface can also be specified within the host’s Main parameters tab.
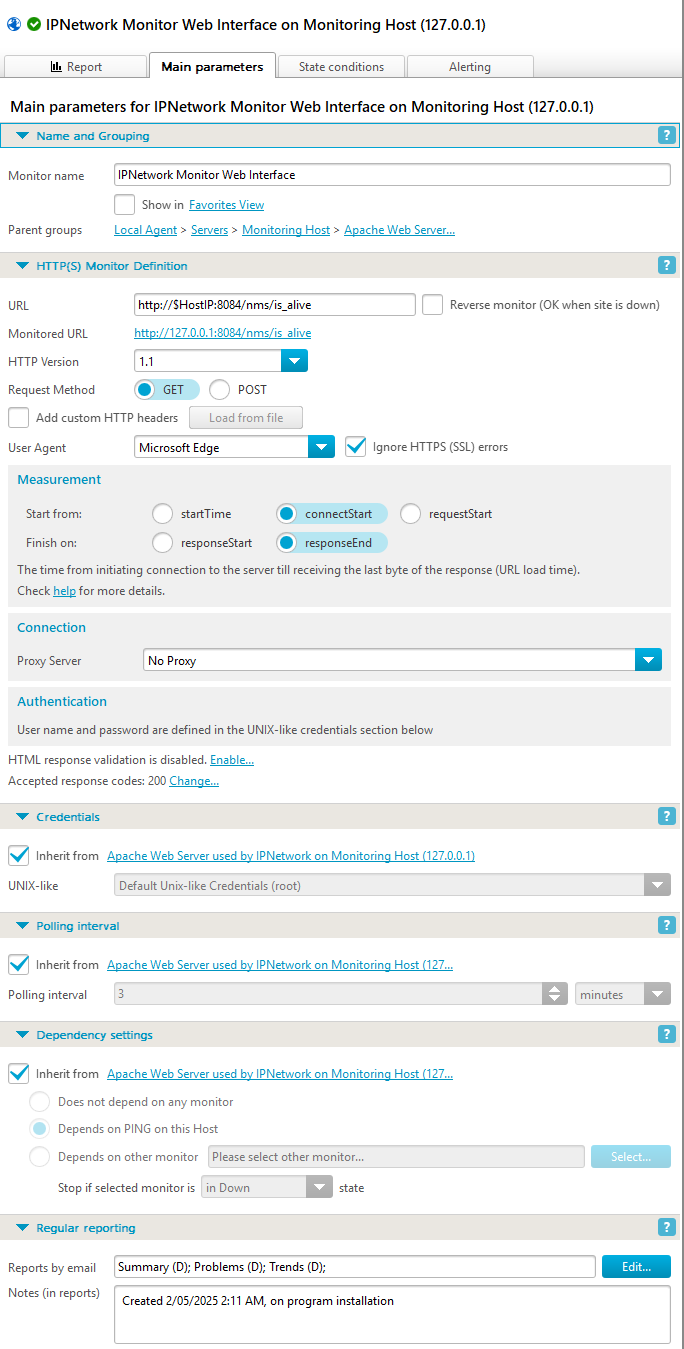
The example image showcasing the HTTP(S) Monitor’s Main parameters tab illustrates all configurable settings: monitor name, group affiliation, the URL to monitor, other type-specific parameters, user credentials for resource access, polling interval, dependency settings, and the email reporting schedule.
Report Tab
The Report tab presents an HTML report for the currently selected monitor or group. Selecting a monitor displays a comprehensive report encompassing a monitor performance graph and a log of all state changes. The default reporting period spans the last 24 hours, adjustable through the Settings dialog (Tools menu). Selecting a monitor group displays a summarized report. Use the toolbar’s Back and Forward buttons to navigate reports in Report View. Refresh a report or open the IPNetwork Monitor Web interface displaying the current report using the Open in browser button. Navigating HTML links within a report or utilizing the Back/Forward buttons updates not only the Report View content but also all other panes to reflect the new monitor or group.
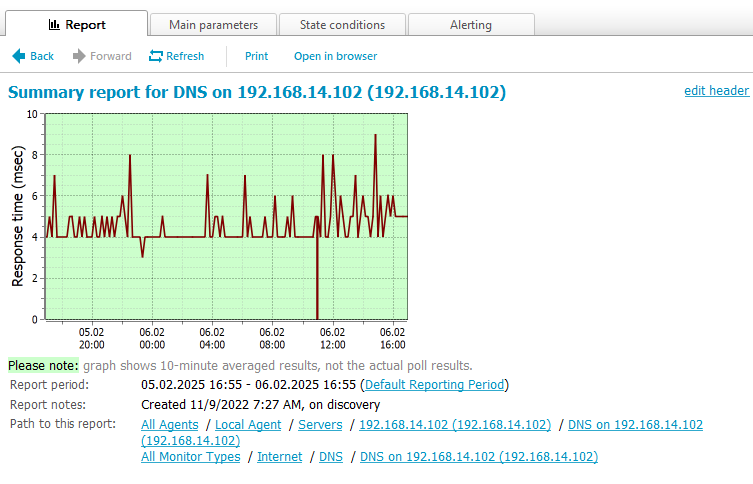
For instance, the Performance and States graphs for the Remote Script or Program Monitor in the image above may reveal intermittent connectivity issues between the monitoring host and the target resource. This detailed data assists in troubleshooting and resolving such problems.
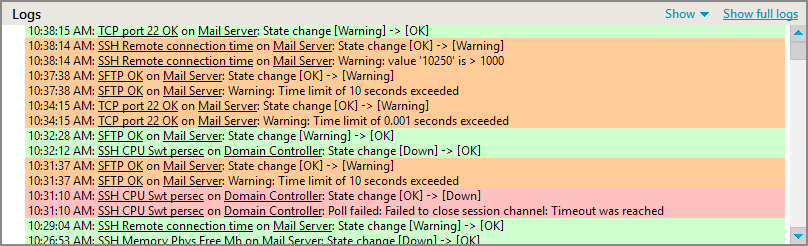
Logs Pane
The Logs pane grants access to log messages stored within the monitoring database. Its configuration allows displaying system messages, monitor state change messages, or both. State change and event records are filtered according to the currently selected monitor or group, ensuring relevance. Host and monitor log entries include hyperlinks; clicking these selects the corresponding object within the Tree View pane, updating all other panes accordingly.
The monitoring client presents logs for the current and previous day. Logs for any desired timeframe can be generated via the Web interface’s Reports tab.
Web Interface Overview
IPNetwork Monitor offers a web interface that facilitates access to monitoring reports. This interface is served by Apache web server, version 2.4.63.
The main window layout of the web interface is shown below: the Dashboard tab offers an overview of your monitoring system.

The Web interface provides diverse views of statistical information and allows you to:
- Review the current and historical statuses of your network resources efficiently.
- Obtain a list of issues that arose within a designated timeframe.
- Analyze performance trends and immediately identify degradations.
- Create comprehensive reports featuring helpful monitor performance graphs and detailed resource state change logs.
On the Reports tab, you can select specific monitor groups for report generation, as well as define custom timeframes or choose from predefined intervals like Today or Last week.
The Web interface’s Reports tab provides several configurable status reports:

The Reports tab includes a Tree View on the left, separated from the Parameters and Report panels by a draggable vertical splitter. The Parameters panel, positioned at the top, is separated from the Report panel by a fixed horizontal gray line.
The Tree View content mirrors that of the client application (Windows UI). An accordion control enables view selection (View by hosts, View by monitor type, View by state, Discovered, or Favorites). After loading the selected tree, you can browse and highlight the desired monitor or resource group, which will then appear in bold. The report is generated upon selecting a tree node and clicking the Generate button within the Parameters panel.
The Parameters panel allows configuring:
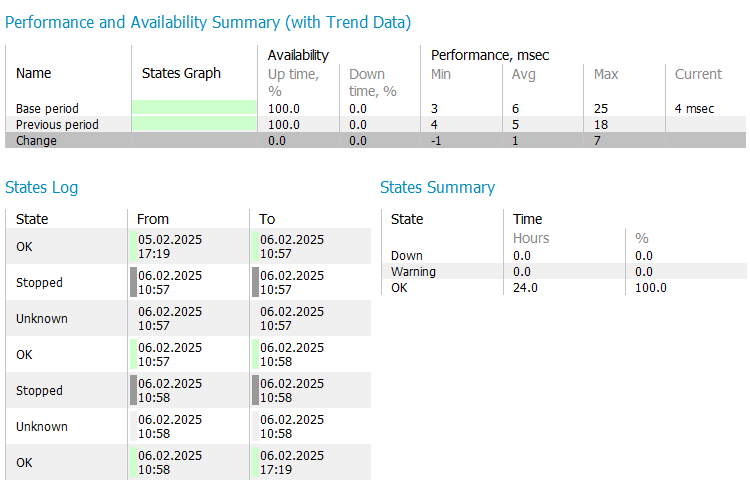
- Report type (via a drop-down menu). Four report types are available: Summary, Problems, Trends, and Logs. A monitor’s summary report includes a monitor performance graph and a state change log. Other reports feature color-coded state change records (“pseudo graphs”) and statistical summaries.
- Report period. Several predefined time intervals are accessible via the drop-down menu, automatically setting the start and end dates. Custom start and end dates can also be specified, setting the report interval to Custom. Dates are selected using a calendar, while times are chosen from a drop-down menu with 30-minute granularity.
Once the report is configured, you can  it (displaying it in the Report panel),
  it (opening it in a new browser window/tab without the Tree View and Parameters panel, along with the standard printer selection dialog), or
  it via email. Sending invokes a form for specifying the recipient address and subject; the default recipient is the administrator’s email address.
Clicking hyperlinks within Web interface reports reloads the entire interface with the corresponding tree node, report type, and interval pre-selected. Sharing these links allows colleagues to directly access specific reports. Opening such a link in a new window/tab creates a duplicate Web interface instance displaying the relevant report. In contrast, navigating the Tree View and adjusting report parameters doesn’t reload the interface; only the Report panel updates upon clicking .
Other features description:
| Monitoring Features | This section lists the monitor types supported by IPNetwork Monitor and provides concise descriptions of their parameters. |
| Network Discovery | Facilitates the creation of your monitoring configuration and automates the process of identifying network hosts and services. |
| Alerting Features | This section details the various alert types available within IPNetwork Monitor, outlining different responses to monitoring issues. |
| Reporting Features | Here you’ll find a summary of the report types available in IPNetwork Monitor, along with brief explanations. |
Related Topics: