IPNetwork Monitor User Interfaces
IPNetwork Monitor offers two interfaces:
A monitoring application (Windows UI) that lets you view and modify the monitoring system’s configuration, and examine reports, graphs, and logs.
A web interface (Web UI) enabling you to see the current status of monitored resources or access reports and graphs displaying monitoring results for any time period from any web-enabled device (e.g., any device with a web browser).
Windows Interface The IPNetwork Monitor Windows interface (also known as the client GUI) lets you initiate, halt, and set up network monitoring, retrieve and evaluate monitoring outcomes, and receive notifications of state changes.
GUI Overview
The IPNetwork Monitor client GUI presents all monitoring configuration options, outcomes, and logs on a single screen. This is designed for efficiency. When adjusting settings, you typically want to observe the impact on monitoring results immediately. Conversely, when a problem appears in the results, you might want to modify the monitoring settings or actions.
The GUI comprises three view panes, along with a standard Windows menu, toolbar, and status bar. 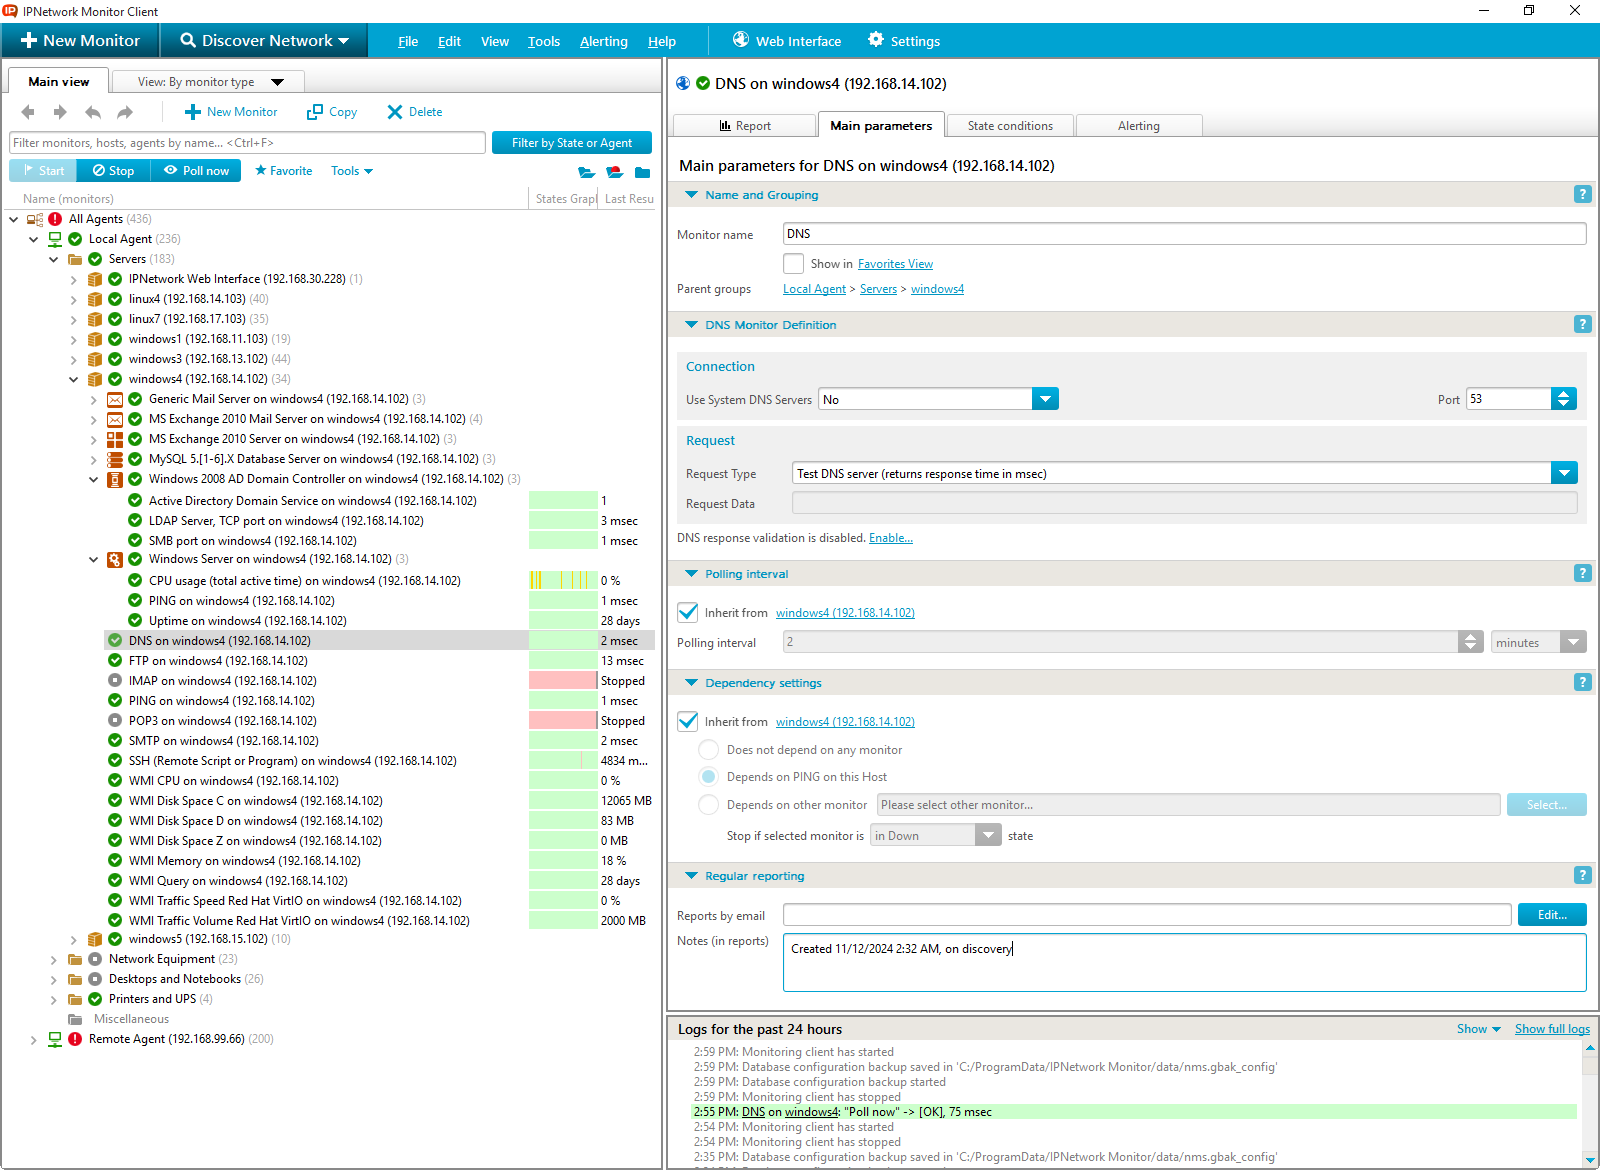
The Windows GUI consists of these three panes:
- Tree View Pane
- Parameters/Results Pane
- Log Pane
The client GUI places an icon in the system tray; this icon persists even after closing the main GUI window. Double-clicking it reopens the client GUI. While the monitoring service is active, the icon reflects the most severe monitor status in your system. When the service is inactive, the icon appears grayed out. Hovering the mouse pointer over the tray icon reveals a status summary tooltip.

When minimized to the system tray, the client GUI uses tray balloons to signal critical system events like monitoring service start/stop events. A tray balloon also appears if a Pop-up window alert is configured for a monitor.

Tree View
The Tree View pane offers various perspectives of monitored entities and allows for quick system status assessment. By default, the Tree View pane displays the By Host tree. A drop-down menu allows switching to By Monitor Type, By State, Discovered, and Favorites views.

Each tree node’s icon represents the worst status among its child monitors. Changing the focus within the Tree View refreshes the content of the other client panes. Commonly used actions are accessible via the Tree View pane’s context menu, which is displayed by right-clicking a selected monitor or group.

Parameters/Results Pane
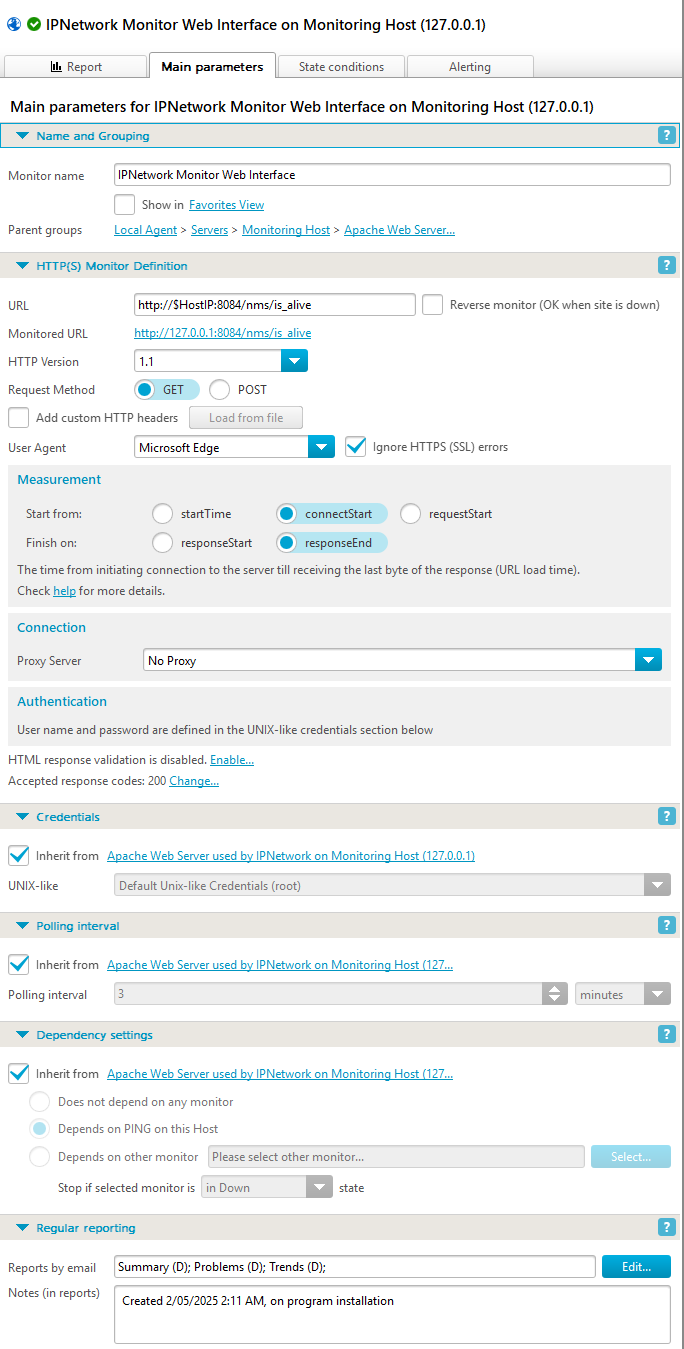 The Parameters/Results pane is where monitoring configuration takes place. It shows all parameters of the currently selected item. Configuration options, including monitor name, description, polling interval, monitor-specific settings, availability settings (like timeouts), performance thresholds, and actions triggered by state changes, are organized within tabs: Main parameters, State conditions, and Alerting.
For monitor groups, this pane also presents a summary of monitor states within the group.
IPNetwork Monitor includes several administrative utilities for managing your hosts (servers) and monitors:
- Remote Desktop Client
- SSH Client
- Telnet Client
You can also define a path to a device’s web interface and designate your preferred tool as a custom administrative tool.
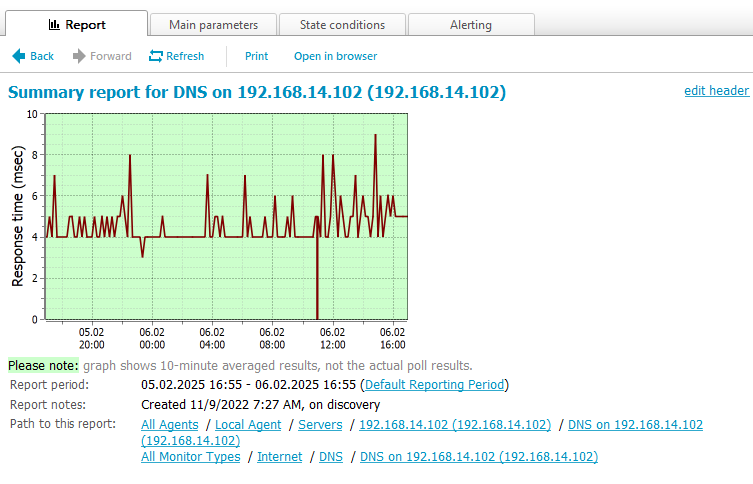
Report Tab
The Report tab displays an HTML report for the currently selected monitor or group. Selecting a monitor generates a detailed report containing a performance graph and a log of all state changes. The default reporting period is the past 24 hours, adjustable in the Settings dialog (Tools menu). Selecting a monitor group displays a summary report. You can navigate reports using the toolbar’s Back and Forward buttons, Refresh a report, and use the Open in browser button to open the IPNetwork Monitor Web interface with the current report. Navigating HTML links within a report or using the Back/Forward buttons updates not only the Report View but also all other panes to reflect the newly selected monitor or group.
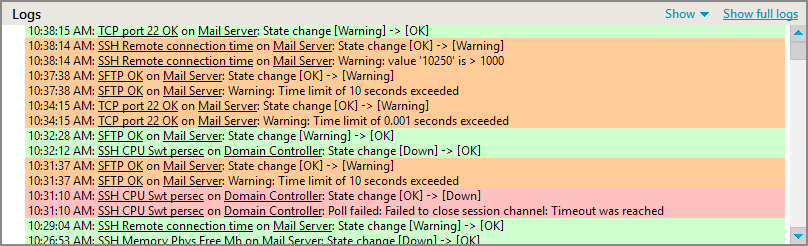
Log Pane
The Log pane provides access to log messages within the database. It can be configured to display system messages, monitor state change messages, or both. Records are filtered according to the currently selected monitor or group. Host and monitor log entries include hyperlinks; clicking these selects the corresponding object in the Tree View, updating all other panes accordingly.
IPNetwork Monitor features a web interface powered by Apache web server, version 2.2.26, providing access to monitoring reports.
The web interface offers several views of statistical data and enables you to:
- review the current and historical states of your network resources
- obtain a list of issues that arose within a specified time frame
- analyze trends and instantly identify performance declines
- access comprehensive reports with performance graphs and detailed resource state change logs
You can select specific monitor groups for report generation and choose any time frame or one of the predefined intervals (e.g., Today or Last week).
The web interface’s main window layout is shown below.

A Tree View resides on the left, separated from the Parameters and Report panels by a resizable vertical splitter. The Parameters panel, positioned at the top, is separated from the Report panel by a fixed horizontal line.
The Tree View mirrors the client application’s Tree View (Windows UI). An accordion control allows view selection (View by hosts, View by monitor type, View by state, Discovered, or Favorites). After loading the chosen tree, you can navigate and select the desired monitor or resource group, which is then highlighted in bold. The report generates after selecting a tree node and clicking the Generate button in the Parameters panel.
The Parameters panel allows you to specify:
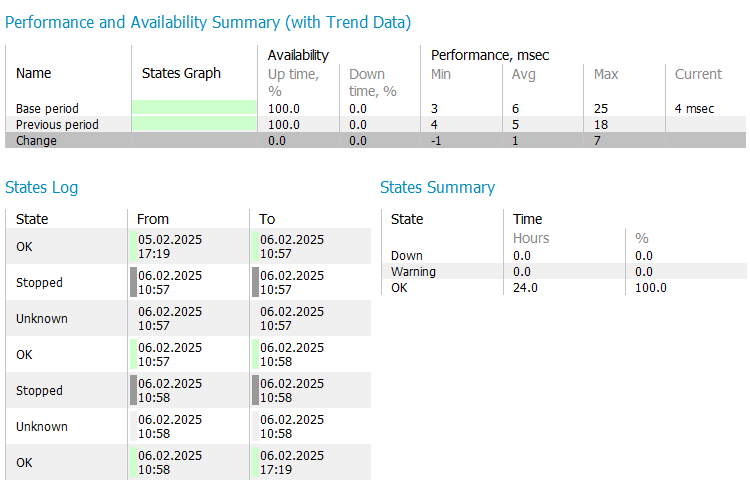
- the report type (via a drop-down menu). Four report types are available: Summary, Problems, Trends, and Logs. Summary reports for monitors include a performance graph and state change log. Other reports provide color-coded state change records and a statistical overview.
- the reporting period. Several predefined time intervals are available via the drop-down menu, which automatically sets the start and end dates. Alternatively, manually define the start and end dates; the report interval will change to Custom. Dates are selected using a calendar, while times are chosen from a drop-down menu with 30-minute increments.
After configuring the report, you can either  it (displaying it in the Report panel) or
  it (opening it in a new browser window/tab without the Tree View and Parameters panel, and prompting you with the Printer selection dialog). You can also
  the report via email (a form will appear to edit the recipient address and subject; the default recipient is the administrator’s email address).
Clicking hyperlinks within web interface reports reloads the interface with the corresponding monitoring object, report type, and interval pre-selected. Share these links with colleagues. Opening the link in a new window/tab creates a duplicate of the web interface, already displaying the specific report. Navigating the Tree View and adjusting report parameters does not reload the entire interface; only the Report panel updates upon pressing .
Other Feature Descriptions
| Monitoring Capabilities | This section details the supported monitor types within IPNetwork Monitor and provides concise descriptions of their parameters. |
| Network Discovery | Facilitates the creation of your monitoring configuration and automates the process of identifying network hosts and services. |
| Alerting Options | This lists the available alert types (responses to monitoring issues) in IPNetwork Monitor, along with brief explanations. |
| Reporting Capabilities | This section outlines the available report types in IPNetwork Monitor with short descriptions. |
Related Topics:
Distributed Network Monitoring