IPNetwork Monitor furnishes a variety of group and detailed reports and graphs, along with logs. These reports hold the information needed to track resource usage patterns and arrange for system enhancements. Furthermore, reports and logs offer the ability to monitor results across specific timeframes. These reports can also serve as documentation for administrators’ performance.
Accessing monitoring reports in IPNetwork Monitor can be done in two ways:
- Reports within the Windows Interface.
The Windows UI (monitoring client) grants access to detailed monitor reports and summarized reports for groups and categories. A reporting duration can encompass any combination of days and hours up to the current time. The standard reporting period is 24 hours (one day) leading up to the present moment. To modify the reporting timeframe for the Windows UI, navigate to Tools > Settings or select the Settings button located on the toolbar. Subsequently, choose the Reporting tab and specify the desired number of days and hours.
- Web Interface
Beyond the Windows client UI, IPNetwork Monitor also offers a Web interface featuring a Reports tab. This tab unlocks access to supplementary report types/formats for any designated timeframe. The Reports tab provides immediate online access to all reports and graphs for any selected period. It comprises three panels: the left panel mirrors the Tree View panel entirely, the top panel facilitates report type and timeframe selection, and the remaining area is dedicated to report display. Mirroring the Windows interface functionality, clicking a report link within the Web interface loads the corresponding report, and the left panel’s focus shifts to the related element.

Report Types
IPNetwork Monitor offers four report categories:
- Overview Report for a Group, Host, Monitor Type, or the Entire System

This report delivers summarized data regarding the availability and performance of monitors within a chosen group, host, monitor type, or the complete system. The simplified graph provides a general visualization of when the monitor experienced issues.
- Individual Monitor Summary Report
Despite sharing a similar name, this report’s content is distinctly different. This report presents comprehensive information on a monitor’s availability and performance over a given duration.

It includes a Performance Graph, summarized data on monitor availability and performance (for a selected period and a preceding period of equal length), a state log (documenting monitor status during the selected timeframe), and summarized state information (quantifying the time spent in problem states and their respective percentages).
- Trend Analysis Report
This report presents comparative data on monitor availability and performance. For each monitor, it displays summarized data for a chosen period, a prior period of identical length, and the variance between them. This report is useful for pinpointing short-term and long-term tendencies in monitor performance and availability.

- Issue Report
Displays summarized information on availability and performance issues that arose within a specific timeframe.

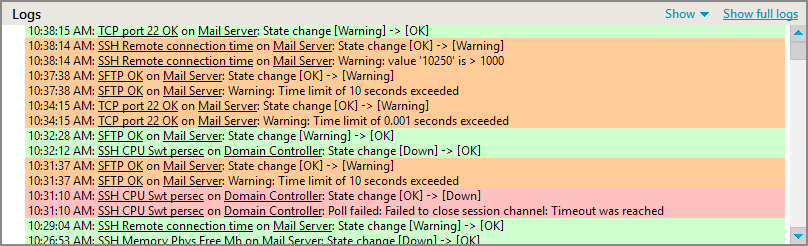
Log
The log displays two message categories for selected monitors:
- general system messages (not monitor-specific, presented in gray text);
- state transitions and actions (the entry is highlighted with a color corresponding to the state).
Log messages are arranged chronologically. You can arrange messages in ascending or descending order within the log view (by clicking the button adjacent to “Order” on the toolbar).
Automated Email Report Delivery
IPNetwork Monitor facilitates the automatic delivery of reports for the past day, week, or month for each monitor, host, host type, or monitor type, as well as for the entire system. By default, IPNetwork Monitor sends a daily summary report for the entire system to the administrator’s email address. You can designate additional recipients.

Description of Other Features
| Monitoring Capabilities | This section details the monitor types compatible with IPNetwork Monitor and provides concise descriptions of their parameters. |
| Automated Network Detection | Assists in establishing your monitoring configuration foundation and automates the process of identifying network hosts and services. |
| Alerting Mechanisms | This section outlines the available alert types (responses to issues encountered during monitoring) within IPNetwork Monitor, along with brief explanations. |
| IPNetwork Monitor Interfaces and Architecture | This section provides an overview of IPNetwork Monitor components, encompassing both Windows and web interfaces. |