
Intermittent server slowdowns are among the hardest problems to diagnose. They vanish before you can catch them, and conventional metrics often look normal while users suffer. Here is what is usually going wrong and how to fix it.
Why slowdowns feel “random” but are not
When your server grinds to a halt for 30 seconds, then snaps back to normal before you can open a terminal, it feels like a ghost. Your monitoring dashboard shows green. CPU looks idle. Memory is fine. Yet users are complaining, and you are staring at a mystery.
The uncomfortable truth: most seemingly random slowdowns have underlying causes that can be identified through historical metrics, logs, or correlation with system activity. In rare cases, hardware faults, intermittent network instability, or race conditions may appear non-deterministic. But what looks random is usually a predictable event: a scheduled task firing, a memory leak crossing a threshold, or a backup job saturating disk I/O.
The classic trap: many teams check metrics after the slowdown resolves. By then, memory has been freed, CPU has cooled, and logs show nothing useful. Catching intermittent slowdowns requires continuous, historical monitoring, not reactive spot checks.
The 6 most common causes of random server slowdowns
Based on server administration communities, enterprise support cases, and performance engineering literature, these are the culprits behind most intermittent slowdowns:
- CPU spikes from runaway processes. A single process or scheduled task can spike CPU utilization, starving other services of processing time. This is especially deceptive when a single-threaded workload saturates one core while overall CPU usage appears low.
- Memory pressure and swap thrashing. When RAM is exhausted, the OS begins swapping to disk. Disk access is orders of magnitude slower than RAM, so even moderate swapping causes dramatic slowdowns. Memory leaks in long-running processes are a common culprit.
- Disk I/O bottlenecks. High read/write activity forces the system to queue disk operations sequentially, creating a bottleneck that can freeze services. Backup jobs, log rotation, and database compaction are frequent triggers.
- Network congestion and packet loss. Saturated bandwidth, misconfigured DNS, or upstream packet loss can make the server appear slow when the problem is in the network layer. High-bandwidth background tasks such as antivirus updates are often overlooked contributors.
- Software and OS-level issues. Outdated drivers, error log accumulation, power plan settings on Windows, and third-party security software can all cause periodic slowdowns that resolve on their own.
- Overlapping scheduled tasks. Cron jobs or scheduled tasks that once ran in 30 seconds may now take 6-7 minutes on a larger dataset. New instances launch before old ones finish, stacking resource consumption until the server struggles.
Step-by-step troubleshooting guide
The goal is to work through each resource layer systematically: CPU, memory, disk I/O, and network. Do not jump to conclusions. Measure first, then act.
Check CPU utilization and identify hot processes
Start with top or htop to see overall CPU usage, then look for per-process breakdowns. On Linux, watch for processes in D state, which means uninterruptible sleep. These processes are waiting on kernel-level operations, most commonly I/O. Other kernel waits can also lead to this state, so it is a signal worth investigating further.
Linux:
top -b -n 1 -d 1
ps aux --sort=-%cpu | head -20
vmstat 1 5
Windows PowerShell:
Get-Counter '\Processor(_Total)\% Processor Time' -SampleInterval 2 -MaxSamples 10Sustained high CPU usage, typically above 70-80%, may indicate CPU pressure, especially if accompanied by increased latency, queueing, or application slowdowns. Interpretation depends on workload characteristics and duration.
Pro tip: on virtual machines, check Linux %steal or CPU steal metrics from your hypervisor. High steal time means your VM is competing for CPU time with other VMs on the same physical host. That is a noisy neighbor problem that no in-guest tuning can fix.
While tools like top show real-time usage, they often miss short-lived spikes. Historical monitoring data provides a clearer picture:
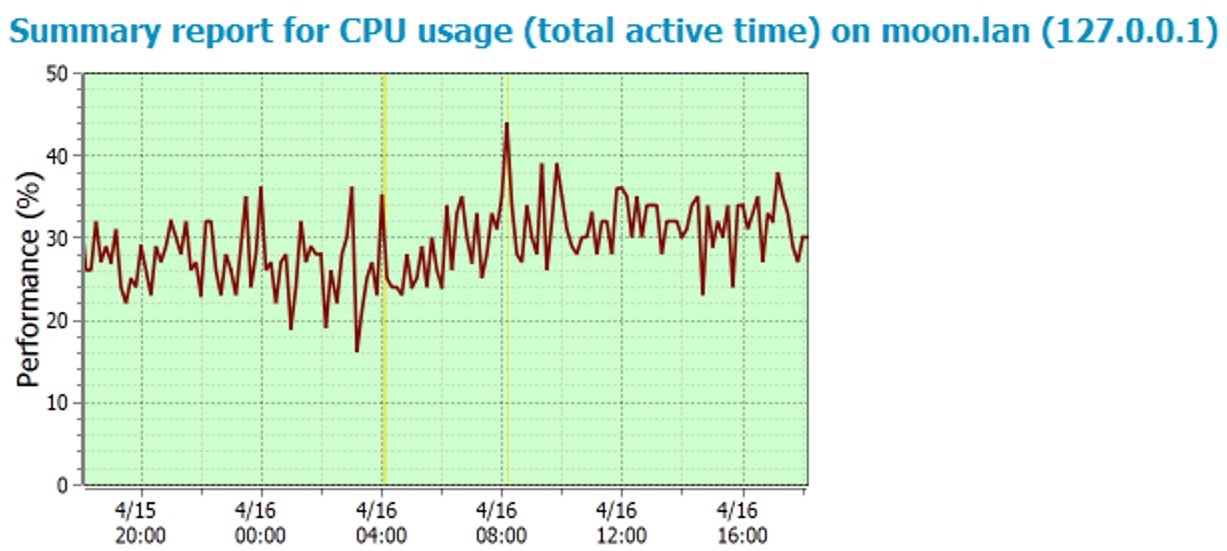
Example of CPU usage over time showing short spikes that are easy to miss in real-time monitoring. Here, a spike to about 44% around 08:00 resolves within minutes, invisible to anyone checking after the fact.
Inspect memory usage and swap activity
Memory issues are among the most deceptive causes of slowdowns. The server can appear to have plenty of free RAM while aggressively swapping cached pages, causing application stalls without maxing out the memory gauge.
Linux – check RAM and swap:
free -h
vmstat 1 5
swapon --show
cat /proc/meminfo | grep -E 'MemAvailable|Swap'
vmstat 1 5   # check si/so columns (swap in/out)
A %commit value above 100% means the system has committed more virtual memory than the sum of physical RAM and swap. This is normal on systems with memory overcommit enabled and does not necessarily imply active swapping. To confirm memory pressure, check swap activity, memory reclaim behavior, and on Windows use RAMMap from Sysinternals to inspect large standby memory usage.
Memory leak watch: compare memory usage immediately after a reboot against usage 24-48 hours later. A steady climb with no obvious cause points to a leaking process. Temporarily disabling high-consumption processes or third-party antivirus helps isolate the culprit.
Memory issues are often not about constant high usage, but about how the system behaves after sudden spikes.
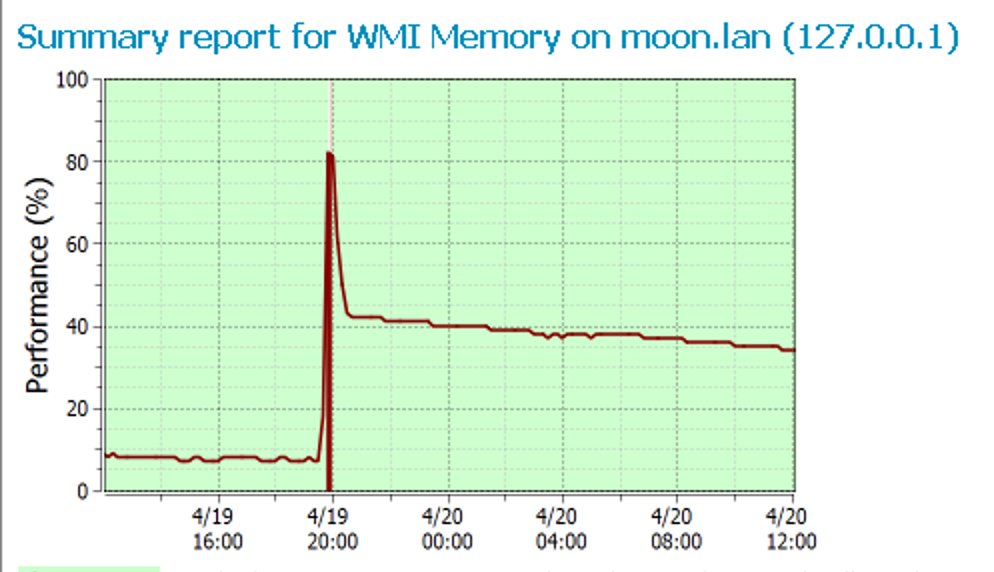
Example of memory usage showing a sharp spike followed by a higher steady-state level. This pattern may indicate memory retention or a potential memory leak.
Notice that memory usage does not return to its original baseline after the spike. This behavior can indicate that memory is not being fully released, which may lead to gradual performance degradation over time.
Diagnose disk I/O, the silent bottleneck
Disk problems cause slow responses even when CPU and memory metrics look healthy. This happens because the CPU sits idle waiting for disk operations, showing low overall utilization while processes queue up behind slow storage.
Linux:
# Real-time I/O stats - watch await and %util
iostat -x 1 10

# Per-process disk usage
iotop -o

# Historical disk metrics
sar -d 1 10   # focus on %await and %util
An elevated await value indicates increased I/O latency. What counts as high depends on storage type: for SSDs and NVMe, even low double-digit milliseconds may be problematic, while higher values may be expected in network-attached or heavily loaded systems. For modern storage systems, %util alone is not enough to determine saturation and should be interpreted alongside latency and queue depth.
Quick fix: check for full partitions with df -h. A partition over 95% full causes failed writes and service instability that can look exactly like a random slowdown. Also consider moving frequently accessed hot files to SSD or NVMe storage.
Disk-related issues often become visible only when looking at historical trends rather than real-time metrics.
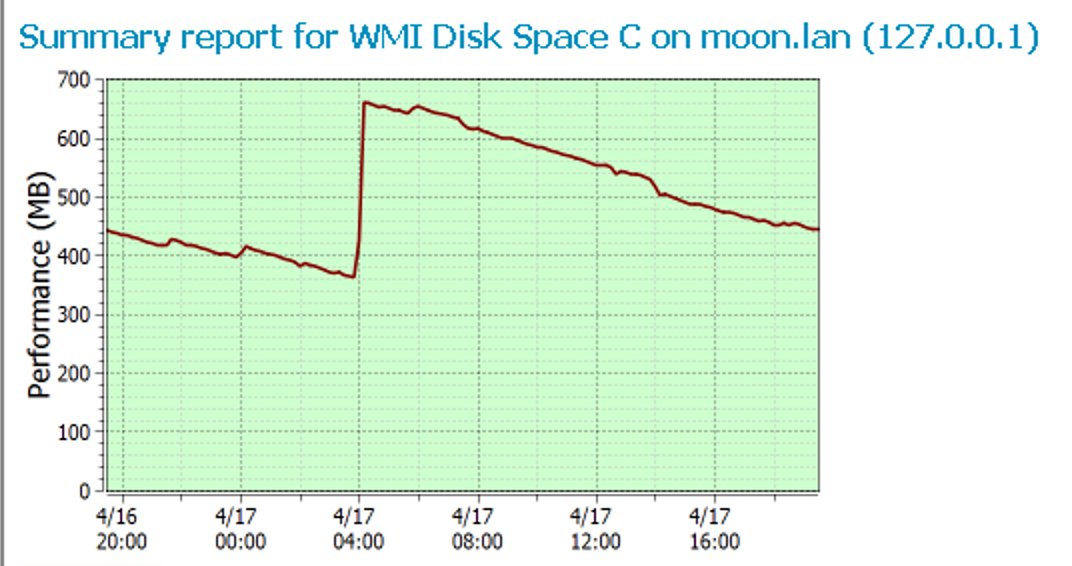
Example of disk usage changes over time showing a sudden increase followed by gradual cleanup. Patterns like this are commonly caused by log growth, temporary files, or background jobs that can impact performance.
Investigate network performance
Network issues are frequently misdiagnosed as server-side CPU or memory problems. Saturated bandwidth, DNS misconfiguration, and packet loss can all make a server appear sluggish from the user’s perspective while internal metrics show nothing wrong.
Linux – network diagnostics:
# Check interface errors and dropped packets
ip -s link

# Test packet loss and latency
ping -c 100 your-gateway
mtr your-destination

# See bandwidth usage
iftop -i eth0   # or nethogs for per-process breakdown
High-bandwidth background tasks such as antivirus signature updates, cloud backups, and teleconferences are well-known triggers for network saturation. Scheduling these operations during off-peak hours can resolve apparent random slowdowns entirely.
Changes in network traffic can often explain sudden performance degradation, especially in distributed or web-based systems.
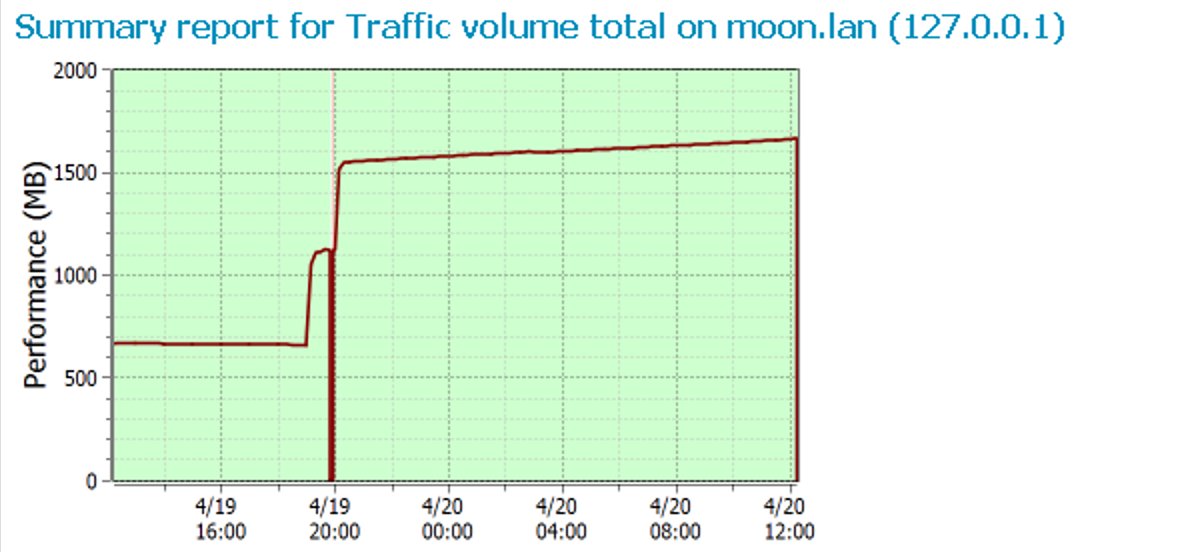
Example of traffic volume showing a sudden increase, indicating a change in workload, followed by sustained higher load.
The sharp increase in traffic indicates a change in workload. When such spikes occur, they can put additional pressure on the server, potentially leading to slower response times and increased variability.
Response time is one of the most important indicators of user experience, because it reflects how quickly the server processes requests.
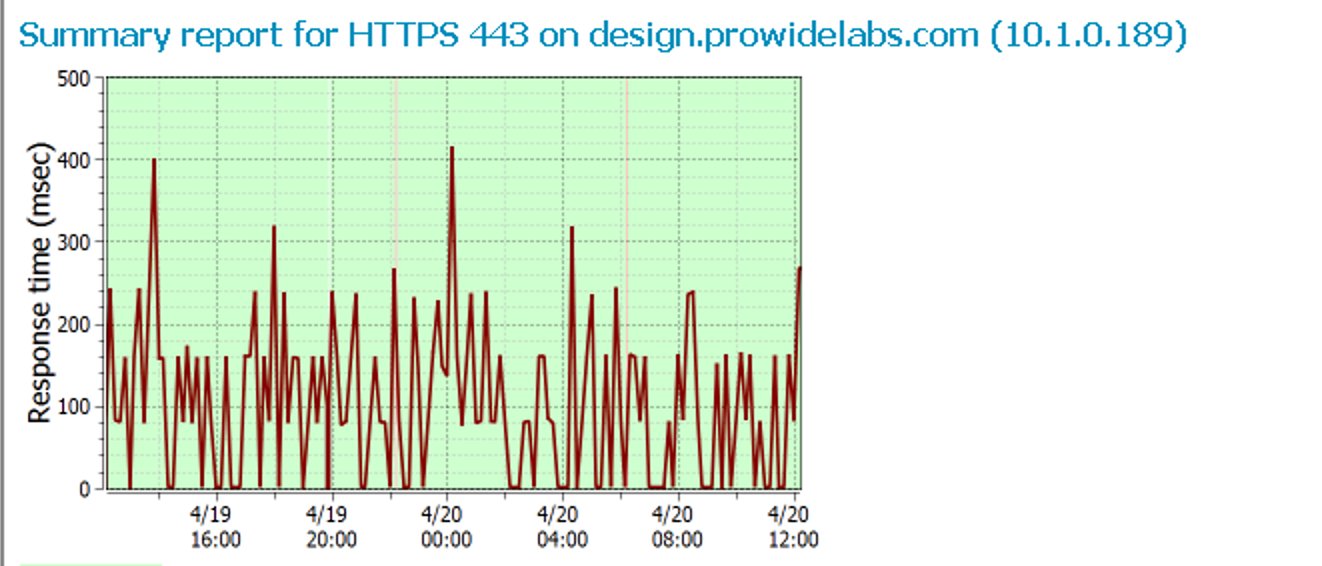
Example of HTTPS response time showing significant fluctuations, with spikes exceeding 400 ms and frequent drops close to zero.
The irregular pattern indicates unstable performance rather than consistent load. Sharp spikes suggest temporary delays in request processing, while near-zero response times in monitoring data may result from measurement artifacts, cached responses, or failed or short-circuited requests. Interpretation requires correlation with error rates and request counts.
Audit scheduled tasks and cron jobs
This step is overlooked more often than any other, yet it is behind a surprising share of random slowdowns. A cron job that ran cleanly in 30 seconds a year ago may now take 7 minutes on a larger dataset, but the schedule was never updated. New instances launch before old ones finish, stacking CPU spikes and memory pressure.
Linux – audit cron jobs:
# List all system-wide cron jobs
ls -la /etc/cron* /var/spool/cron/

# Check recent cron executions
grep CRON /var/log/syslog | tail -100

# Find currently running processes started by cron
ps aux --sort=-%cpu | head -20
Windows – list scheduled tasks:
Get-ScheduledTask | Where-Object {$_.State -eq 'Running'}
schtasks /query /fo LIST /v | findstr "Task Name|Status|Last Run"
Cross-reference your scheduled tasks with the timestamps when slowdowns occurred. If a backup, report generation, or cleanup job runs at 2:00 AM every night, and your slowdowns consistently appear around that time, you have found the cause, even if it felt random before you looked.
Collect continuous performance logs for repeat events
For slowdowns that recur but disappear before you can investigate interactively, set up continuous metric collection. This gives you forensic data to analyze after the event.
Windows – start a continuous performance log:
logman create counter PerfLog -f bincirc -max 500 ^
  -c "\Processor(_Total)\% Processor Time" ^
     "\Memory\Available MBytes" ^
     "\PhysicalDisk(_Total)\Avg. Disk sec/Transfer" ^
  -si 5 -o C:\PerfLogs\server_slowdown
logman start PerfLog
logman stop PerfLog   # run after a slowdown event
On Linux, sar, System Activity Reporter, collects comprehensive metrics continuously in the background when sysstat is installed. Review historical data with sar -A and narrow down to the exact minute the slowdown occurred.
Key metric thresholds to watch
Use these reference values when reviewing your performance data. A single spike above these levels is not always a problem. Sustained or recurring violations are what indicate a real issue.
| Metric | Tool | Healthy | Warning | Critical |
|---|---|---|---|---|
| CPU utilization | top, Task Manager |
< 70% | 70-85% | > 85% sustained |
| Memory used | free -h, Resource Monitor |
< 80% | 80-90% | > 90% |
| Memory commit (%) | sar -r |
< 100% | 100-120% | > 120% (add RAM) |
| Disk I/O await | iostat -x |
< 20 ms | 20-50 ms | > 50 ms |
| Disk utilization | iostat |
< 60% | 60-80% | > 80% sustained |
| Disk space used | df -h |
< 80% | 80-90% | > 95% |
| Swap activity (si/so) | vmstat |
0 | Occasional spikes | Sustained > 0 |
| Network packet loss | ping, netstat -s |
0% | 0.1-1% | > 1% |
The fundamental challenge with intermittent issues is that by the time you check, all these metrics look normal again. A slowdown that lasted 45 seconds will have fully resolved before your next manual check. This is why the troubleshooting steps above matter, but continuous monitoring is the real long-term answer.
How IPNetwork Monitoring prevents random slowdowns
The single biggest obstacle in diagnosing intermittent server slowdowns is that they are gone by the time you look. IPNetwork Monitoring solves this by continuously collecting performance data from every monitored host, giving you historical trends, threshold alerts, and correlated reports that make the invisible visible.
Monitor Linux servers via SNMP
For Linux hosts, IPNetwork Monitoring uses SNMP, v2c or v3, to retrieve system metrics directly from the kernel via the Net-SNMP daemon. Once net-snmp is installed and configured on the target host, IPNetwork Monitor’s built-in MIB browser lets you browse to the OID branches that matter most for performance troubleshooting:
Key SNMP OID branches for Linux performance:
CPU load:    1.3.6.1.4.1.2021.11  (systemStats)
Memory:      1.3.6.1.4.1.2021.4   (memory)
Disk space:  1.3.6.1.4.1.2021.9.1 (dskEntry)
To enable disk monitoring, add one disk line per mount point to /etc/snmp/snmpd.conf and restart the SNMP daemon. Disk OIDs only appear after this step. From there, IPNetwork Monitor’s predefined monitors cover CPU load, memory usage, disk space per filesystem, and process statistics, all with configurable alert thresholds.
Security note: use SNMPv2c with a read-only community string at minimum. SNMPv3 provides stronger authentication and encryption and is recommended for production environments. SNMPv1 should be avoided.
Monitor Windows servers via WMI
On Windows, IPNetwork Monitoring uses WMI to query the same resource layers: CPU, memory, and disk, without requiring additional agent software. Key monitors include:
- WMI CPU: tracks total active time, user time, system time, interrupts per second, and context switches per second. High context switch rates indicate thread contention.
- WMI Memory: monitors physical memory, page file, and virtual memory usage in either MB or percentage of total.
- WMI Disk Space: reports used and available space per filesystem, giving you the historical trend view that catches log growth and temporary file accumulation before it becomes critical.
- WMI Process: counts matching processes or aggregates CPU and memory usage for a named executable, useful for isolating runaway processes.
Windows Event Log monitoring: IPNetwork Monitoring can also count or retrieve events from any Windows Event Log channel, including Application, Security, System, and custom channels, filtered by severity level, source, and keyword. This is valuable for catching silent errors that often precede a slowdown.
Distributed monitoring with Remote Network Agents
If your infrastructure spans multiple buildings or remote sites connected by high-latency links, polling devices across that link introduces monitoring delays that can skew your data. The Remote Network Agent (RNA) solves this by running inside the target network and collecting monitoring data locally, then forwarding results to the primary IPNetwork Monitoring server over the existing link.
A single RNA can monitor multiple devices in its local network segment. It only needs to be installed on every server when a server must collect its own local data. Once deployed, the RNA appears in the Remote Agents panel, where you can enable or disable monitoring, trigger network discovery, and push remote upgrades from the central console.
Historical reports and web-based access
All collected metrics feed into IPNetwork Monitoring’s web interface, where summary reports are generated. The charts showing CPU spikes, disk space jumps, memory retention after a spike, and traffic volume changes are exactly what you see when reviewing historical data for a specific host. The reporting page can be restricted to specific users via HTTP Basic authentication when you want to give operations teams read-only access to performance reports.
Conclusion
IPNetwork Monitoring captures CPU, memory, disk I/O, and network metrics continuously. When a slowdown happens at 3 AM, you have a complete forensic trail waiting for you in the morning instead of another “it fixed itself” mystery.
Use historical metric replay, SNMP and WMI monitoring, Remote Network Agents, web-based reports, and threshold alerts to catch intermittent slowdowns before users do. Download a free trial to start monitoring your servers.