
You open your browser, type in a URL, and nothing happens. Or worse, the page loads but forms will not submit, features silently fail, or the spinner just keeps spinning. Yet an uptime checker insists the website is “up.” Sound familiar?
This is one of the most frustrating scenarios in IT: a website that is technically reachable but functionally broken. The root causes span everything from a stale cache on your laptop to a server-side incident thousands of miles away, and the fix depends on which side of that divide the problem lives.
This guide walks you through the most common causes, a step-by-step troubleshooting process, and how a dedicated monitoring solution like IPNetwork Monitor can transform a reactive scramble into a fast, evidence-based fix.
“Up” vs. “working”: why the difference matters
Basic uptime checkers often confirm only whether a server responds to HTTP requests. For a basic HTTP check, a 200 OK response may be enough to mark the site as “up.” But a site can return 200 OK and still be unusable: broken JavaScript, database timeouts, CDN misconfigurations, an expired SSL certificate on a subdomain, or a login system that silently fails.
A website can pass basic uptime checks and still be unusable for many users.
The ping command can confirm that a host responds to ICMP, but some servers block ICMP even when the website is working fine. A failed ping does not always mean the host is unreachable. Equally important, a successful ping only means the host, or a device in front of it, responded to ICMP. It tells you nothing about whether the web server is running, whether the application can handle requests, whether the database is connected, or whether a real user can actually do anything on the site. Reachability is not the same as functionality.
The distinction matters because the diagnosis and the fix are completely different depending on where the problem lives: your device and network, or the server and its infrastructure.
Common causes: client-side vs. server-side
Before you can fix anything, you need to know where to look. Every cause falls into one of two buckets.
Client-side causes
These issues exist on your device or local network and do not affect other visitors.
- Stale browser cache: your browser serves outdated local copies after a site update, causing broken layouts, missing features, or authentication loops.
- Local DNS issues: your ISP’s DNS server or your own DNS cache may hold outdated records, preventing resolution even when the server is running fine.
- Extensions and security software: ad blockers, VPNs, firewalls, and antivirus tools can silently block page resources or interfere with SSL validation.
- Outdated browser or OS: modern sites depend on current TLS versions and browser capabilities. Old software causes handshake failures and JavaScript errors.
- Local network or ISP: packet loss and high latency can cause pages to partially load, with images missing, API calls timing out, or dynamic content absent.
Server-side causes
These issues may affect many or all visitors and usually require action from the website owner or hosting provider.
- Server overload: traffic spikes from product launches, viral moments, or seasonal surges overwhelm capacity, producing timeouts and 503 errors.
- DNS misconfiguration: a typo in a nameserver, a recent DNS record change, or propagation delays can make your domain unresolvable for many visitors.
- Expired SSL or domain: an expired certificate triggers hard browser blocks. An expired domain can quickly disrupt access once DNS and registrar changes take effect.
- Faulty plugin or deployment: a bad code push or plugin conflict can break your site while the server itself remains fully operational and “up.”
- DDoS attack: coordinated traffic floods overwhelm bandwidth and resources. Response times may degrade gradually before total failure, or a sudden outage can occur.
- Hosting or hardware failure: shared hosting outages or hardware failures can take a site offline with no warning and go unnoticed for hours without monitoring.
Step-by-step troubleshooting guide
Work through these steps in order. The first goal is to determine whether the problem is on your end or the server’s, then act accordingly.
1. Confirm whether the problem is local or global
This is the single most important first step because it determines everything else.
- Try from a different device, such as phone vs. laptop, and a different network, such as Wi-Fi vs. mobile data.
- Use a site checker like
isitdownrightnow.comordownforeveryoneorjustme.com. - If it loads for others, the problem is local. Continue to steps 2-5. If it is down globally, skip to step 6.
2. Clear your browser cache and cookies
Stale cached data is responsible for many local loading issues. This resolves many “works for everyone else” complaints.
- Chrome / Edge: Settings > Privacy and Security > Clear Browsing Data > Cached Images & Cookies.
- Faster test: open the page in a private or incognito window. This bypasses cache and extensions.
- If it loads in incognito but not normally, the issue is cached data or a browser extension.
3. Try a different browser and disable extensions
- If Chrome fails, try Firefox, Edge, or Safari. All interpret web pages slightly differently.
- Disable extensions one by one. Ad blockers and security tools are the most common culprits.
- Temporarily pause your firewall or antivirus to check whether it is blocking the connection.
4. Flush your DNS cache and switch DNS servers
- Windows: open Command Prompt and run
ipconfig /flushdns. - Mac: open Terminal and run
sudo dscacheutil -flushcache; sudo killall -HUP mDNSResponder. - If that does not help, switch to a public DNS server such as Google DNS,
8.8.8.8, or Cloudflare,1.1.1.1.
5. Restart your router and check your connection
- Unplug your router for 60 seconds, reconnect it, and wait for the connection to re-establish.
- If other websites load normally, your general internet connection is fine, and the issue is specific to this site.
- Try from a completely different location to rule out ISP-level blocks or routing issues.
6. Check server-side health
If the issue is confirmed global, or you own the website, check the server side:
- Check your hosting provider’s status page for reported outages or maintenance.
- Review server error logs in cPanel or your control panel for 500, 502, or 503 errors.
- Verify your SSL certificate and domain registration expiry dates.
- For WordPress: deactivate all plugins, switch to a default theme, then reactivate one by one.
- If you recently deployed code changes, roll back to the last known-good version.
Pro tip: when you report an issue to your hosting provider, include the exact error message, the time it started, the browser and OS you are using, and whether it affects all visitors or just you. This dramatically speeds up diagnosis.
Quick reference: common error codes
The error code your browser displays is your most important diagnostic clue. Here is what each one means.
| Error code | What it means |
|---|---|
| 404 Not Found | The server cannot locate the requested page, usually because of a broken link or deleted resource. |
| 403 Forbidden | The server understood the request but is refusing to process it because this client has no access rights. |
| 500 Internal Server Error | A server-side error, often a misconfiguration, bad plugin, or code fault. |
| 502 Bad Gateway | The server received an invalid response from an upstream server, common in load-balanced environments. |
| 503 Service Unavailable | The server is temporarily unable to handle requests, usually because of overload or scheduled maintenance. |
| 504 Gateway Timeout | A gateway or proxy did not receive a timely response from an upstream server, often because of a database or backend timeout. |
| ERR_NAME_NOT_RESOLVED | DNS could not translate the domain to an IP address. This may indicate DNS failure, an expired domain, or a local DNS problem. |
| ERR_CONNECTION_RESET | Something interrupted the connection mid-process, such as unstable internet, VPN software, an outdated browser, or security software. |
| ERR_CONNECTION_TIMED_OUT | The page took too long to respond, which can indicate server overload, high latency, or a firewall blocking the connection. |
Stop reacting. Start monitoring.
Troubleshooting a broken website after users start complaining is inherently reactive. By the time you work through the steps above, you may have already lost sales, damaged reputation, or disrupted business-critical operations. The deeper problem is simple: without continuous monitoring, you are flying blind.
A server can go down at 3 AM. An SSL certificate can expire on a Sunday. DNS records can break silently. Without monitoring, you may not know until a customer tells you.
The difference between a 5-minute fix and a multi-hour incident is whether you know before your customers do.
What is IPNetwork Monitor?
IPNetwork Monitor is a comprehensive network monitoring solution that gives IT teams full visibility into infrastructure health: websites, servers, network devices, and remote branches. Rather than waiting for an outage to surface through user reports, IPNetwork Monitor continuously checks your systems and alerts you the moment something goes wrong.
Key capabilities
- Real-time website monitoring: continuously checks whether your websites and services are accessible and responding correctly. Alerts fire the moment a site goes down or starts returning error codes.
- SNMP monitoring for servers: retrieves CPU load, memory, disk usage, and process stats via standard MIB OIDs from Linux and network devices. Supports SNMP v2c and v3 with pre-built monitors for common metrics.
- Remote Network Agents: deploy an agent inside each remote office or branch. It collects data locally and forwards results to the central console without additional tunneling.
- WMI Windows monitoring: monitor CPU, memory, disk, and processes on Windows servers natively without installing agents on every machine.
- Flexible alerting: get notified through the right channels the moment a threshold is breached. Alerts can be configured per monitor, team member, and severity level.
- Custom reporting: historical uptime data, performance trends, audit trails, and a reports-only web interface for stakeholders who need visibility without full access.
The chart below shows what this looks like in practice. IPNetwork Monitor’s HTTP(S) summary report gives you an at-a-glance view of your site’s response time over any period. Instead of hearing about a slowdown from an angry customer, you see it the moment it begins.
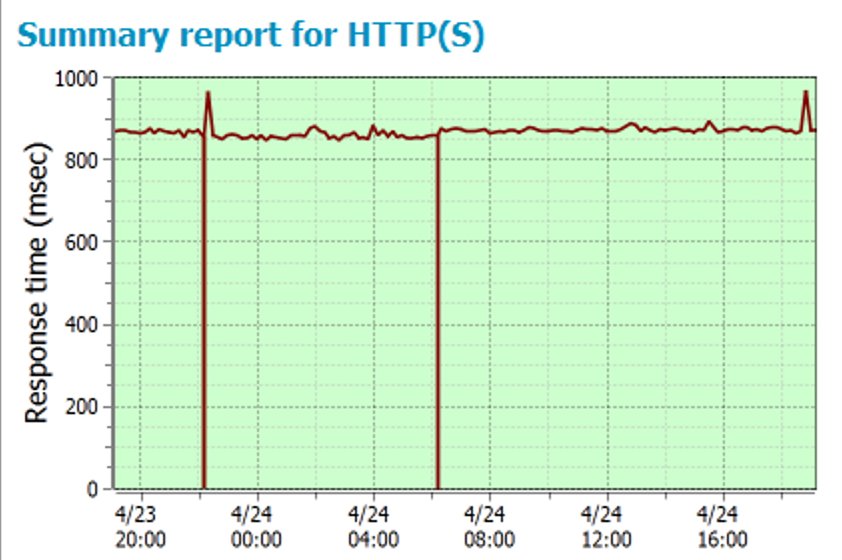
HTTP(S) summary report in IPNetwork Monitor: 24-hour response time view. The baseline holds steady around 860-880 ms all day, confirming normal operation. The two vertical drops to zero appear to indicate monitoring gaps or failed measurements. The spike near the end of the window moves toward 1,000 ms: a transient slowdown that a basic uptime checker would never flag because the page still loads.
That late-window spike is a clear illustration of why response time monitoring matters beyond simple up/down checks, and why catching early signs of degradation is so important.
A DDoS attack can cause response times to rise gradually, from 200 ms to 1,000 ms to 5,000 ms to timeout, or it can create a sudden outage. Either way, response time monitoring catches the pattern early, long before users start complaining.
Going deeper: Web Transaction monitoring
A plain HTTP check only tells you the server responded. It says nothing about whether your login form works, whether the checkout flow completes, or whether a critical API endpoint returns the right data. Web Transaction monitoring fills that gap by replaying a scripted sequence of real user actions end-to-end and measuring how long each step takes.
Typical scenarios worth scripting for most websites:
- Login flow: submit credentials, assert the dashboard loads, and verify the session cookie is set correctly.
- Search and results: enter a query, confirm results appear within an expected time, and check that pagination works.
- Add to cart / checkout: add a product, proceed to checkout, and verify the order summary reflects the right items and price.
- Form submission: fill in a contact or registration form, submit it, and assert the confirmation message or redirect fires.
- API health check: call a critical endpoint and validate the response code and body, not just that something came back.
- Authenticated pages: confirm that protected routes are actually protected and that logged-in users see the right content.
The chart below shows what Web Transaction monitoring looks like in practice over the same 24-hour window as the HTTP(S) report above, but at a different scale.
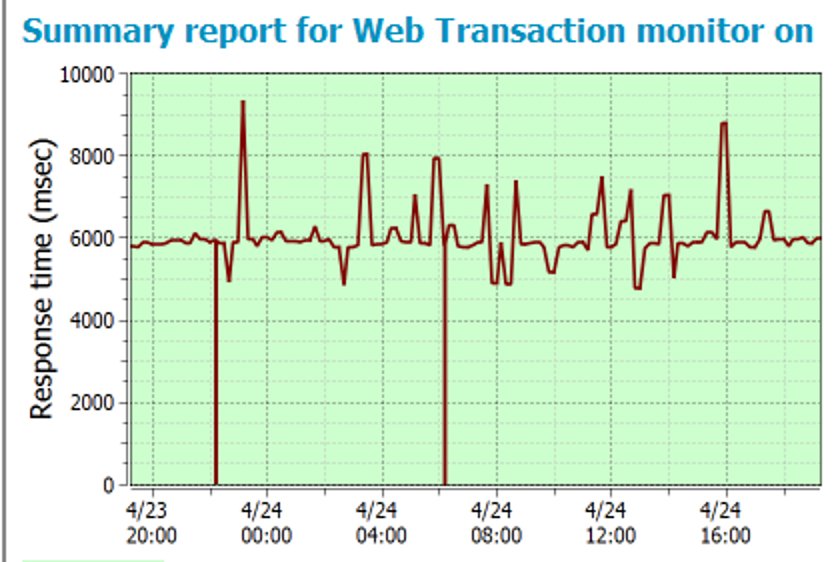
Web Transaction summary report in IPNetwork Monitor: same 24-hour window, but now measuring full transaction time rather than a single HTTP response. The baseline sits around 6,000 ms because each check replays multiple steps: loading assets, executing JavaScript, and waiting for dynamic content. Repeated spikes to 8,000-9,000 ms and drops to zero pinpoint moments where individual steps in the flow failed or timed out.
Comparing both charts side by side makes the point this article opened with: a site can pass basic uptime checks and still be effectively broken for real users. HTTP(S) monitoring tells you the door is open; Web Transaction monitoring tells you the path inside is clear.
Prevention checklist
Whether you are a website owner or IT administrator, these practices significantly reduce the risk and impact of outages.
- Set up continuous monitoring: check your site and infrastructure around the clock with a tool like IPNetwork Monitor.
- Monitor SSL certificate expiry: set alerts 30, 14, and 7 days before expiration. Automate renewal where possible.
- Monitor domain registration expiry: enable auto-renewal and add calendar reminders as a backup.
- Monitor DNS records: watch for unexpected changes in nameservers or A records that could indicate hijacking.
- Monitor server resources: track CPU, memory, and disk trends. Set thresholds before you reach critical levels.
- Use staging environments: test all code deployments and plugin updates before pushing to production.
- Keep regular off-site backups: ensure you can roll back to a known-good state within minutes of any failed deployment.
- Choose hosting with strong uptime SLAs: cheap shared hosting often means outdated servers and slow incident response.
- Implement DDoS protection: a CDN with built-in mitigation absorbs attack traffic before it reaches your server.
- Document your incident response plan: know who to call, what to check, and in what order before something goes wrong.
Conclusion
A website being “up” and a website “working” are two very different things. The causes span both ends of the connection, from a stale cache on one user’s machine to a server-side infrastructure crisis. The investigation process is systematic, and most issues can be resolved quickly once you know where to look.
For end users, the troubleshooting steps in this guide cover the vast majority of scenarios. For website owners and IT teams, the deeper lesson is that reactive troubleshooting is costly in time, customer trust, and revenue.
IPNetwork Monitor gives IT teams the visibility they need to detect issues the moment they emerge, not an hour later when users start calling. With real-time website checks, SNMP server monitoring, WMI metrics, and distributed Remote Network Agents for multi-site environments, it provides a comprehensive picture of your infrastructure’s health from a single console. Download a free trial to start monitoring before the next incident.