Server performance generally refers to a collection of parameters (like CPU load, process count, disk usage, etc.) that indicate server capabilities and help determine if the server’s overall condition is satisfactory.
To ensure a server can handle a specific load (e.g., website visitor capacity, email server message volume), performance testing is essential. This prevents unexpected server failures due to overload and provides data for optimizing service efficiency.
Numerous performance testing tools exist, though they are often specialized and offer a limited range of tests.
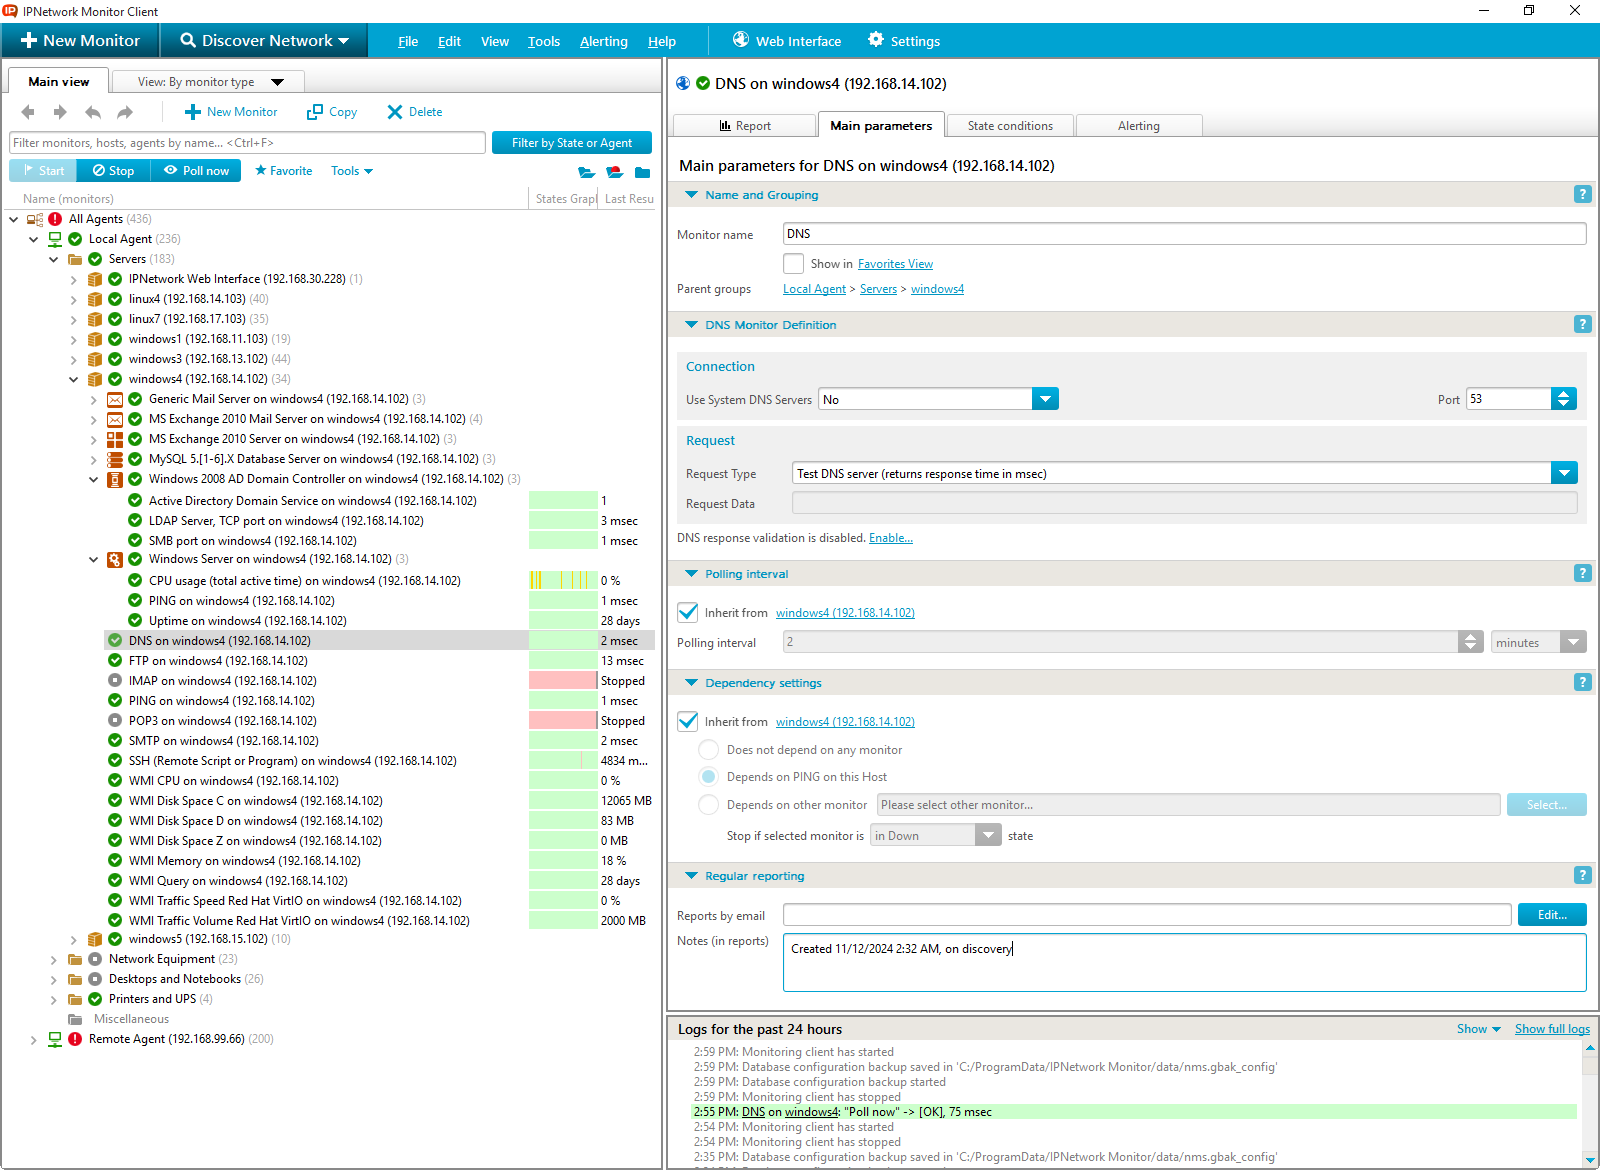
IPNetwork Monitor provides a comprehensive solution, capable of both server performance monitoring and testing (see “Microsoft server monitoring“). This clearly identifies when server resources are exhausted (through alerts), effectively functioning as stress testing software.
Any resource with well-defined performance metrics (i.e., parameters that can be tested against acceptable values) can be evaluated for performance.
Website load testing often involves simulating multiple concurrent users by running numerous HTTP and/or Web Transaction Monitors. Polling intervals can be adjusted to mimic real-world user behavior.
Similarly, Web service performance testing can utilize remote monitoring agents accessing the service from various IP addresses to better simulate realistic load conditions.
This approach applies to other test types, like application performance tests (launching multiple application instances or connecting to an existing application to send processing data).
More general tests, such as system performance tests, can be conducted by executing scripts/programs that consume system resources, simulating high-usage scenarios.
Load performance testing subjects the service or device to simulated (“virtual”) or real connections to observe performance behavior and identify degradation points.
Server uptime monitoring measures the duration a service remains accessible and performs acceptably. Note that this isn’t necessarily tied to the operating system’s overall uptime.
Therefore, a server uptime monitor can track general server uptime or that of a specific service.
Each test uses specific performance testing metrics. For website load testing, these include average and peak response times, connection count, concurrent users, CPU load, memory usage, and requests per second.
Server availability indicates a state where performance parameters are within acceptable limits and all services function as expected.
Different testing methodologies may be necessary for specific scenarios (e.g., testing specific website functionality like form processing or file uploads).
 |
 |
|
| Windows Interface Screenshot | Web Interface Screenshot |