In this brief guide, we’ll configure an SNMP monitor to collect TCP connection statistics. This data can be utilized for tracking TCP activity and/or managing TCP connections. Click the images below for a larger view.
Introduction
| IPNetwork Monitor supports all SNMP versions (see the monitor properties editor section). | 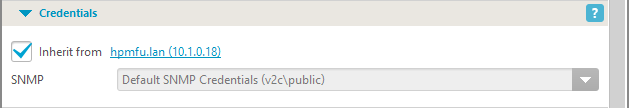 |
| IPNetwork Monitor offers tools to monitor a specific value, or detect when it changes. It can also verify value validity. | 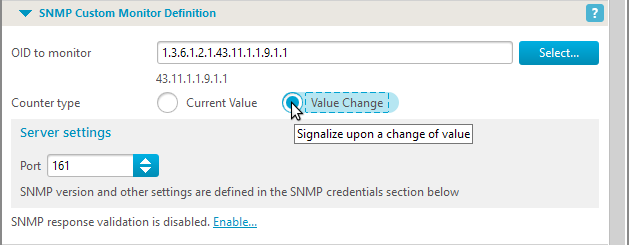 |
| A handy MIB browser is available. It allows navigation of the entire OID tree, filtering for specific values, and retrieving element descriptions. Access it from the “Tools” menu… | 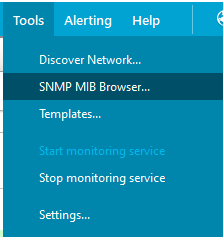 |
| …or via the [Select…] button next to the OID value on the monitor’s Main parameters tab. | 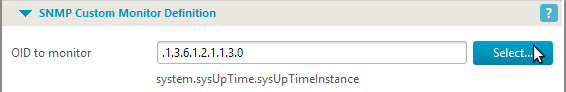 |
The MIB browser can:
|
 |
Starting SNMP services on the host
| This tutorial does not cover the complete setup, configuration, and initiation of SNMP services on the monitored host. Consult documentation for software like net-snmp and/or firewall configurations for secure SNMP setup. This tutorial assumes SNMP services are configured and accessible from the IPNetwork Monitor machine. |
Creating the SNMP monitor
| First, add a new host for your device (select “New Host” from the “File” menu, or right-click a host group and select “New Host”). | 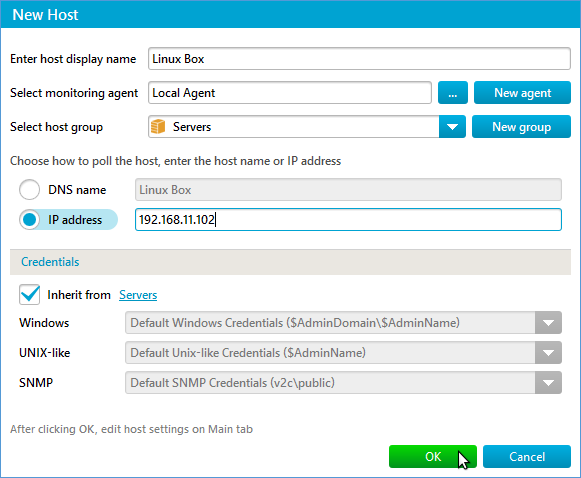 |
| After adding the host, right-click it and select “New Monitor”. | 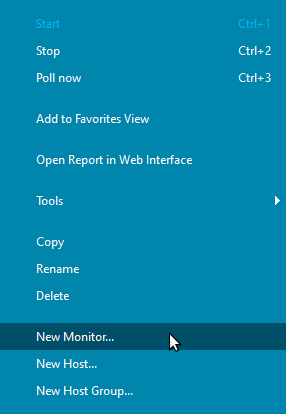 |
| Choose “SNMP Custom” and click “Next”. | 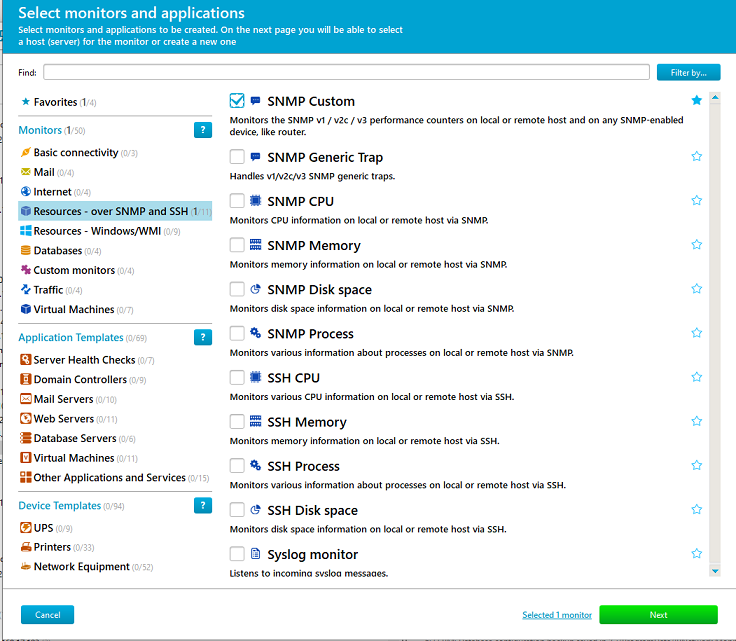 |
| Enter the hostname of the target device. If ready, check “Start the monitor” to activate it immediately. Click “Next”. | 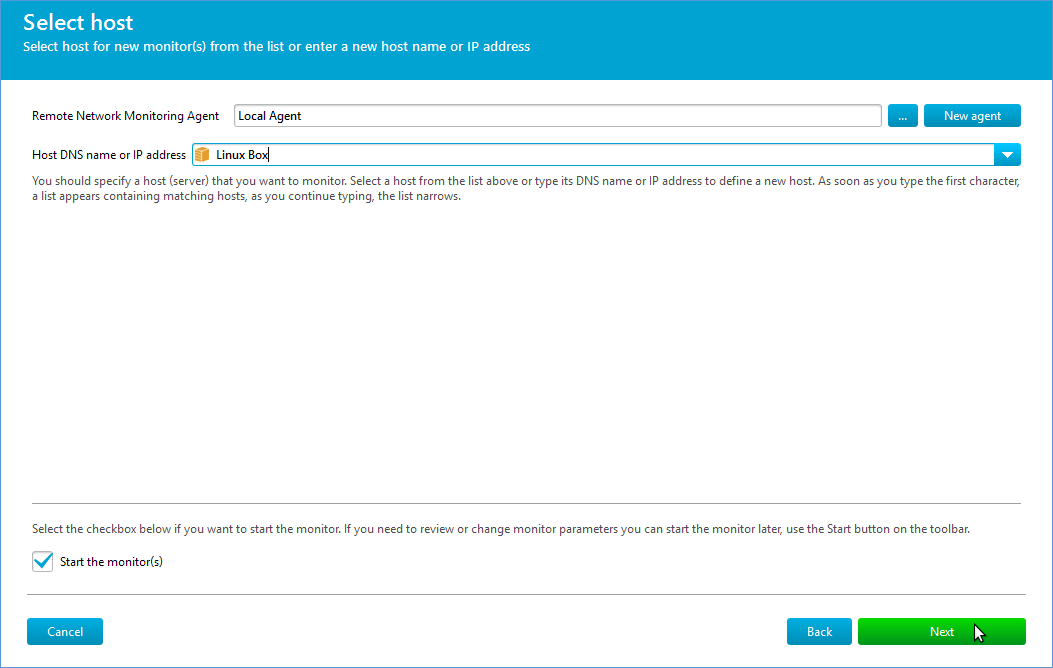 |
| Here, you can select the OID, upload MIBs, configure alert thresholds, and other monitor parameters (explained below). Note: IPNetwork Monitor is unavailable while this wizard is open. Click “Finish” when done, or configure further in the “Property Editor”. |  |
Configuring monitoring parameters
| Open the MIB browser (see above). Without the correct MIB file (RFC1213-MIB), the browser will have limited information. Download the MIB, click “MIBs” (bottom-left), and check if it’s loaded. | 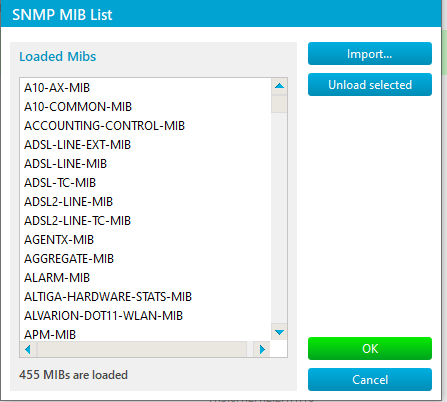 |
| If RFC1213-MIB is listed, skip this. Otherwise, place it in %ProgramData%\IPNetwork Monitor\mibs and click “Import”. Choose the file and click “Open”. |  |
| Refresh the MIB browser. To locate TCP connection state OIDs, enter “tcpConnState” next to “Find”. The browser will filter the results.
Note: Individual TCP connection entries are encoded by combining the branch OID with destination and source IP addresses and ports. This allows individual connection monitoring. This tutorial monitors local SMTP (OID tail: 0.0.0.0.25.0.0.0.0.0). For more advanced monitoring, like listing all active connections to a port, consider a custom script and a different monitor type. Custom SNMP entries are also an option (see SNMP server documentation). Choose the best approach. Select the entry and click “OK”. |
 |
| Configure an alarm for non-‘listen’ states. In the “Performance Monitoring” section, you’ll find two alarm levels: “Warning” (non-critical issue) and “Down” (critical issue). Set thresholds based on your requirements. This example uses ‘2’ for a critical alert. See the Alerting and Actions guide for more details. |  |
Next steps
| You’ve created an SNMP monitor to track the SMTP process! Now what? | |
| Adjust the polling interval on the Main parameters tab. The default 60 seconds (1 minute) can likely be increased (e.g., to 5 minutes). | 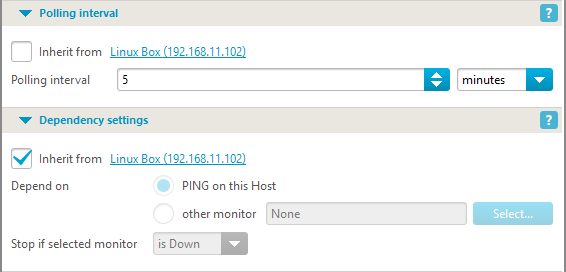 |
| Modify or add more monitors for other services. Create a script to manage connections by setting them to specific values. | |
| Consult the quick start guide for further SNMP monitor usage examples. | |