In this brief guide, we’ll configure an SNMP monitor to track **IP packet statistics** (such as packets delivered and discarded).
Click the thumbnails to enlarge the images.
Introduction
| IPNetwork Monitor supports all SNMP versions (refer to the monitor’s Main parameters tab). | 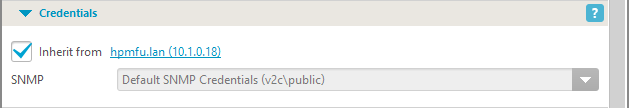 |
| With IPNetwork Monitor, you can monitor specific values, check for changes in values, or verify value validity. | 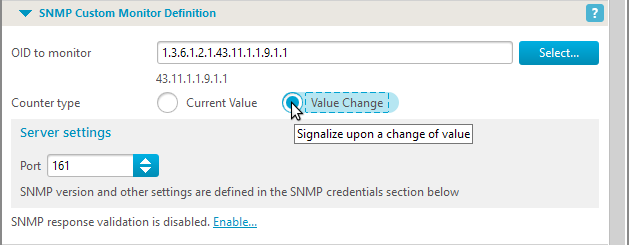 |
| A robust MIB browser helps you navigate the collected OIDs. Access it via the “Tools” menu… | 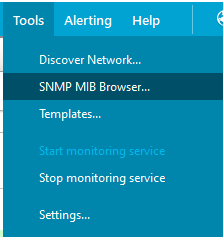 |
| …or by clicking the Select button next to the OID value on the monitor’s Main parameters tab. | 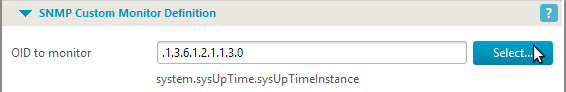 |
The MIB browser enables you to:
|
 |
Starting SNMP services on the target host
| This tutorial does not cover the complete setup, configuration, and initiation of SNMP services on the monitored host. Please note that not all devices provide IP statistics parameters. Verify support before proceeding. Most network devices and computers do support them. Consult the documentation for software like net-snmp and/or firewall configurations for secure SNMP setup. We assume you have configured SNMP services and granted access to the IPNetwork Monitor machine. |
SNMP monitor creation
| To begin, add a new host (select “New Host” from the “File” menu, or right-click a host group and choose “New Host”). | 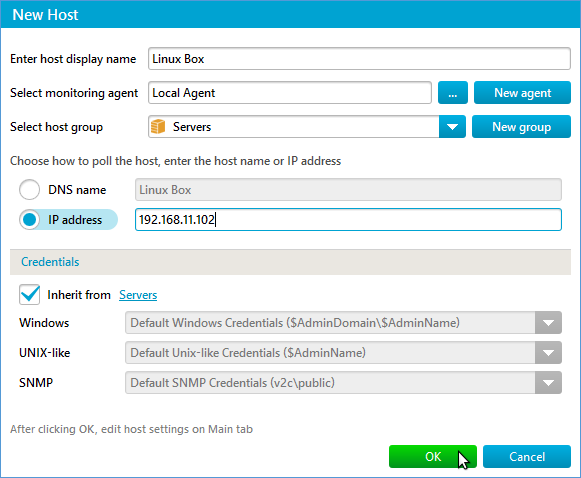 |
| After adding the host, right-click it and select “New Monitor”. | 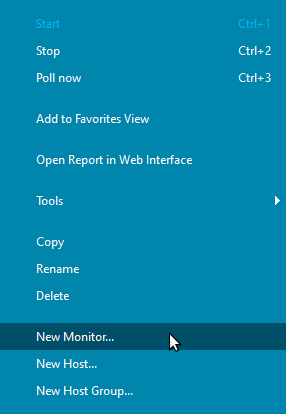 |
| Choose the “Resources – over SNMP and SSH” category, select the “SNMP Custom” monitor type, and click “Next”. | 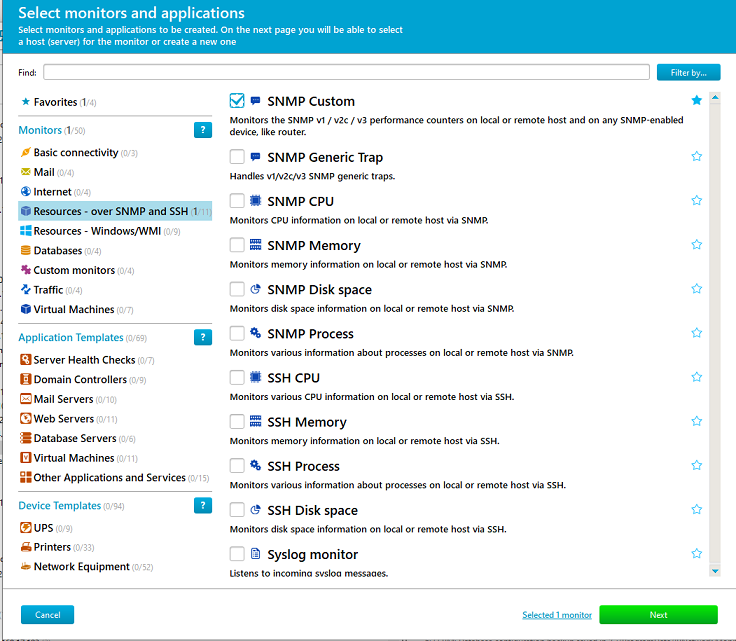 |
| Next, enter the hostname of the device being monitored. If ready, check “Start the monitor” to activate it immediately. Click “Next”. | 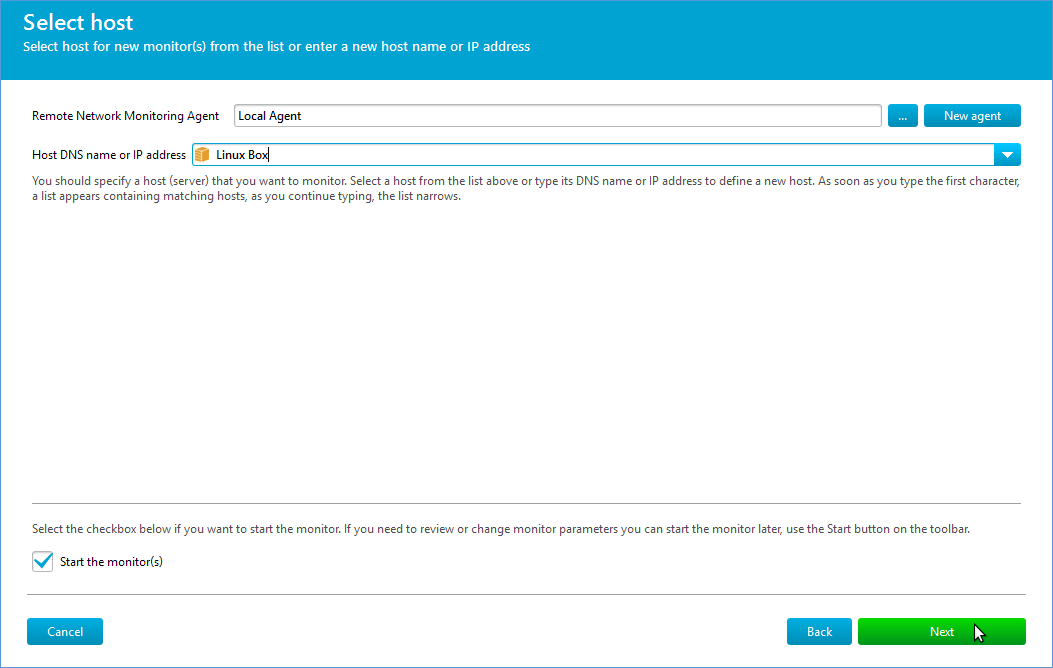 |
| On the final screen, select the OID, upload any necessary MIBs, configure thresholds, and adjust other monitor parameters. Details are below. Note: IPNetwork Monitor is unavailable while the wizard is open. Click “Finish” when done, or configure the monitor in the “Property Editor”. | 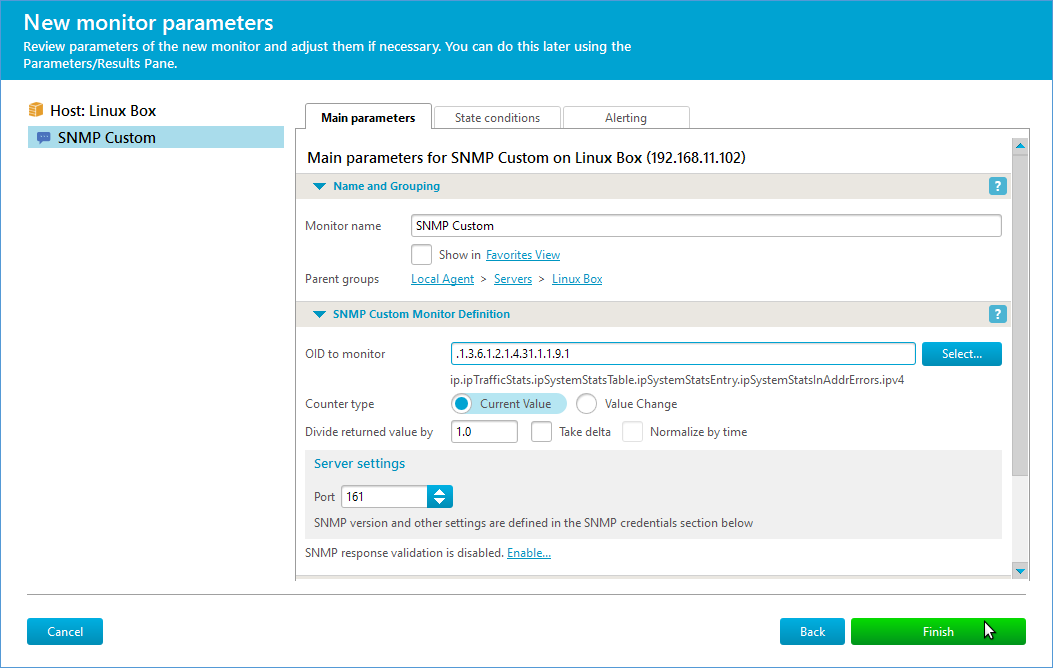 |
Configuring monitoring parameters
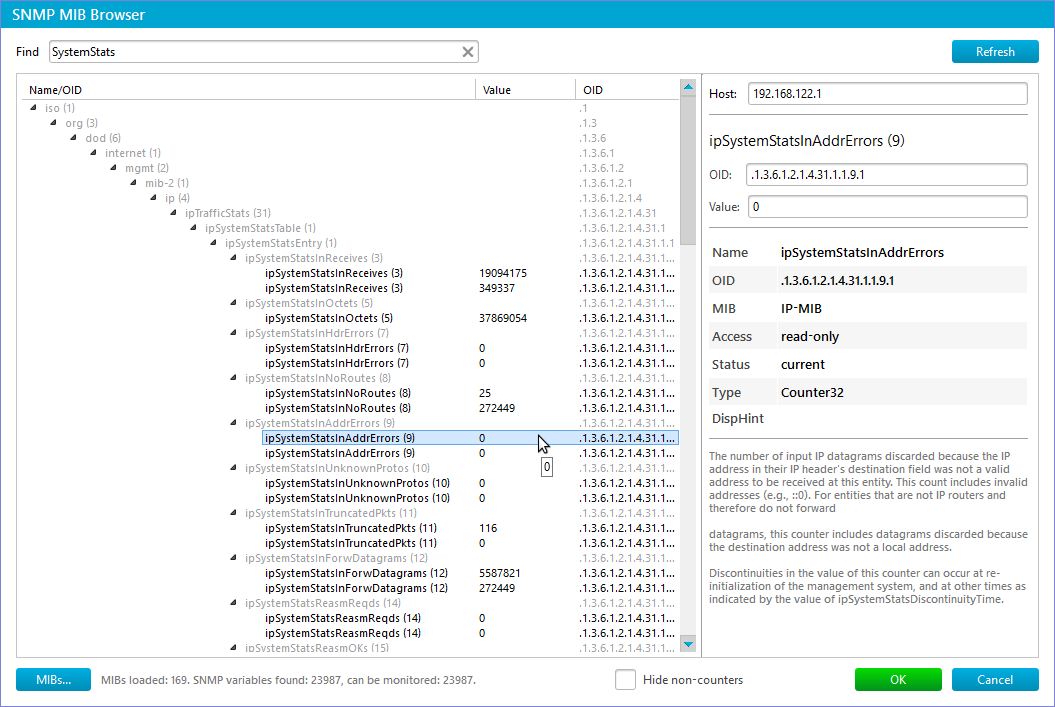
| Open the MIB browser (see instructions above). Without the correct MIB file (IP-MIB), the browser will have limited information. Download the MIB, click “MIBs” (bottom-left of the browser), and check if it’s loaded. | 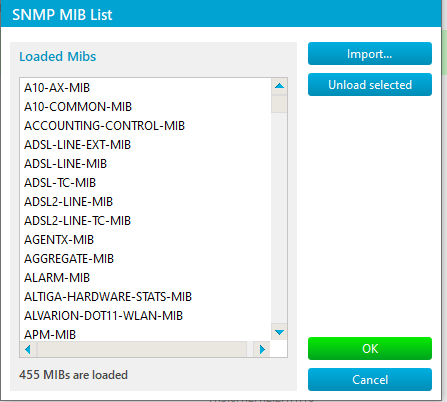 |
| If IP-MIB is listed, skip this step. Otherwise, ensure the MIB file is in %ProrgamData%\IPNetwork Monitor\mibs and click “Import”. Choose the MIB and click “Open”. | 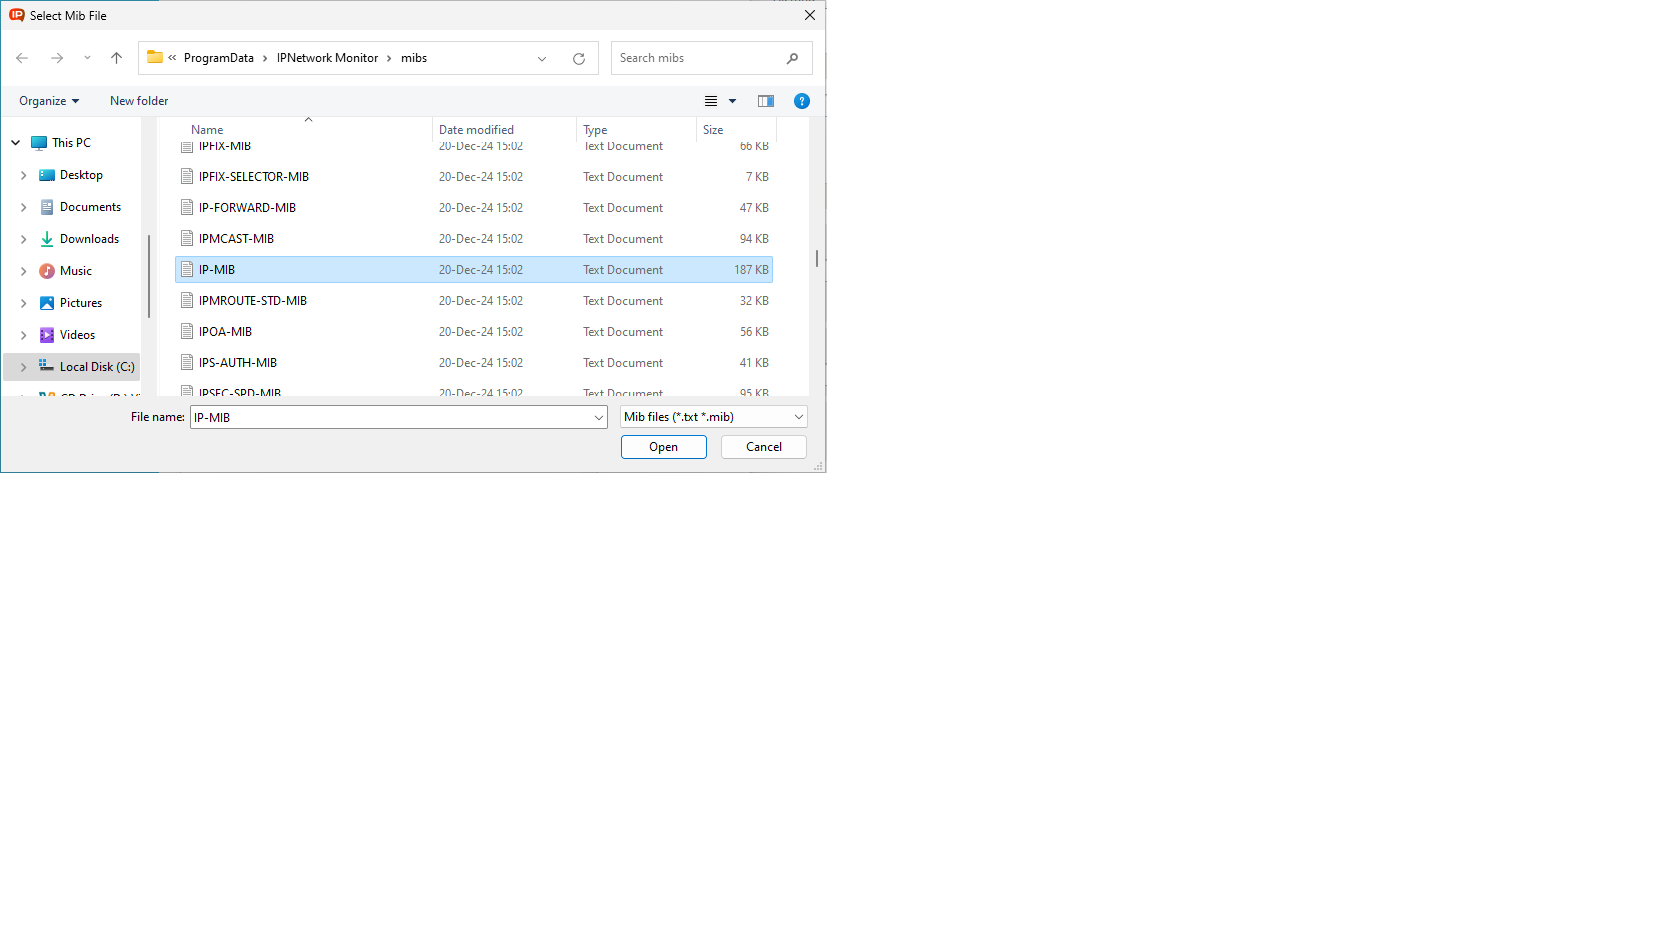 |
| Refresh the MIB browser by clicking “Refresh”. Search for “SystemStats” to find relevant OIDs. For this example, we’ll use `ipSystemStatsInAddrErrors` (counts invalid destination IP addresses). Explore other options in this branch if needed. Select the entry and click “OK”. | |
| Configure alerts for high error counts. Use the State conditions tab. The warning state signifies a potential issue, while the down state indicates a critical problem. In this example, a warning triggers at 1000 errors, and an alarm at 30000. See the Alerting and Actions section for more details. | 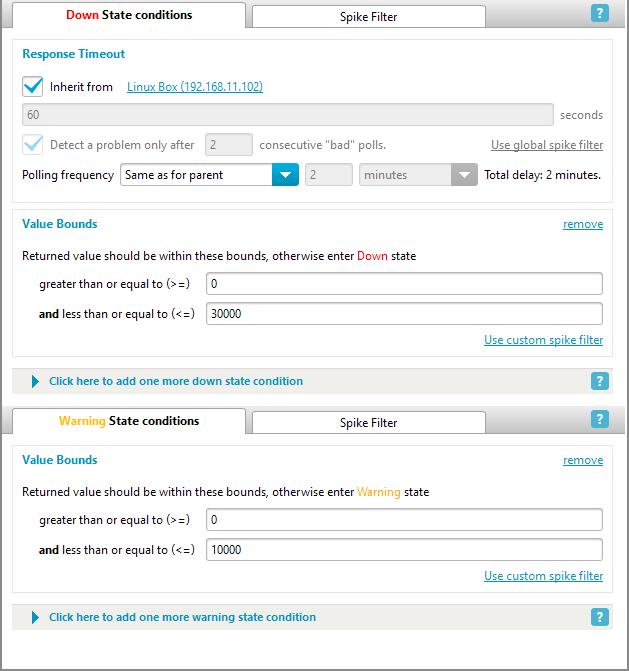 |
Next steps
| You’ve created an SNMP monitor to alert you about excessive invalid packets! What’s next? | |
| Adjust the polling interval on the Main parameters tab. Increase the default 60 seconds (1 minute) as needed, for instance, to 5 minutes. | 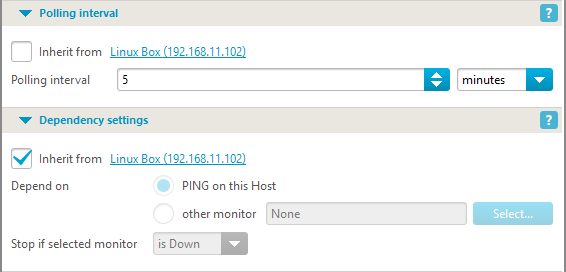 |
| You can modify the monitor to track the rate of invalid packets. Change the counter type to “Delta” and adjust thresholds accordingly (e.g., warn if more than 50 invalid packets are received per interval). | |
| For further guidance, refer to the quick start guide. | |