In this brief guide, we’ll configure an SNMP monitor to track the administrative status of a network interface (testing, up, or down). Click the thumbnails to see the full-sized images.
Introduction
| IPNetwork Monitor is compatible with all SNMP versions (see the monitor properties editor). Version 1 is generally not recommended due to various security vulnerabilities. | 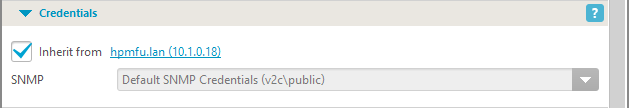 |
| With IPNetwork Monitor, you can monitor a specific value, check if it has changed, or verify its validity. | 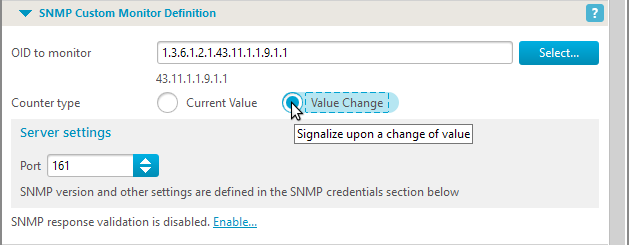 |
| A robust MIB browser allows navigation of the entire OID tree. Access it from the “Tools” menu… | 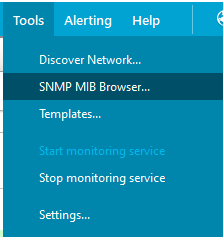 |
| …or via the Select button next to the OID value in the monitor’s properties editor. | 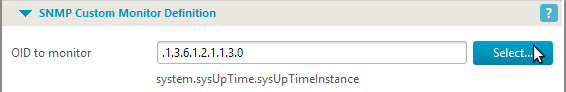 |
The MIB browser lets you:
|
 |
Starting SNMP Services on the Target Host
| This tutorial does not cover setting up, configuring, or starting SNMP services on the monitored host.
Note that not all devices support IP statistics parameters. Verify support before proceeding. Most network devices, computers, etc., do offer this functionality. Consult documentation for software like net-snmp and/or firewall configurations for secure SNMP setup. This tutorial assumes you’ve configured SNMP services and granted access to the IPNetwork Monitor machine. |
SNMP Monitor Creation
| To begin, add a new host representing your network device (computer, router, etc.) via “New Host” in the “File” menu or by right-clicking a host group and selecting “New Host.” | 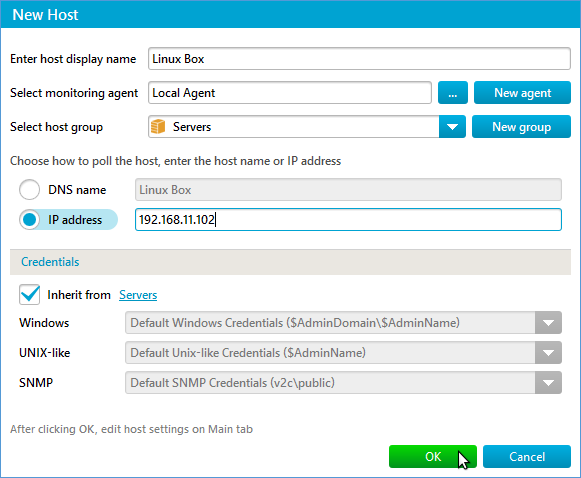 |
| After adding the host, right-click it and choose “New Monitor.” | 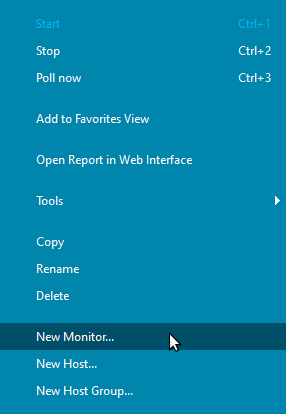 |
| Select “Resources – over SNMP and SSH,” then “SNMP Custom,” and click “Next.” | 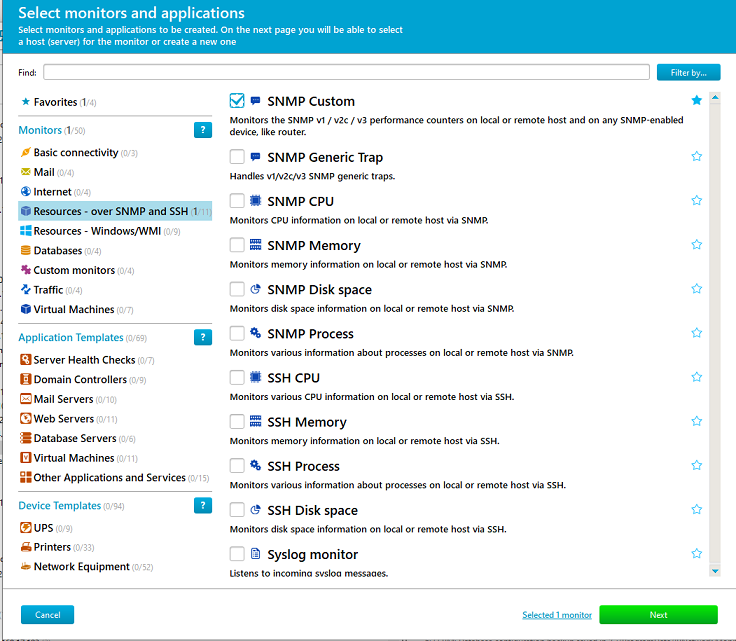 |
| Next, enter the device’s hostname. If ready, check “Start the monitor” to activate it immediately. Click “Next.” | 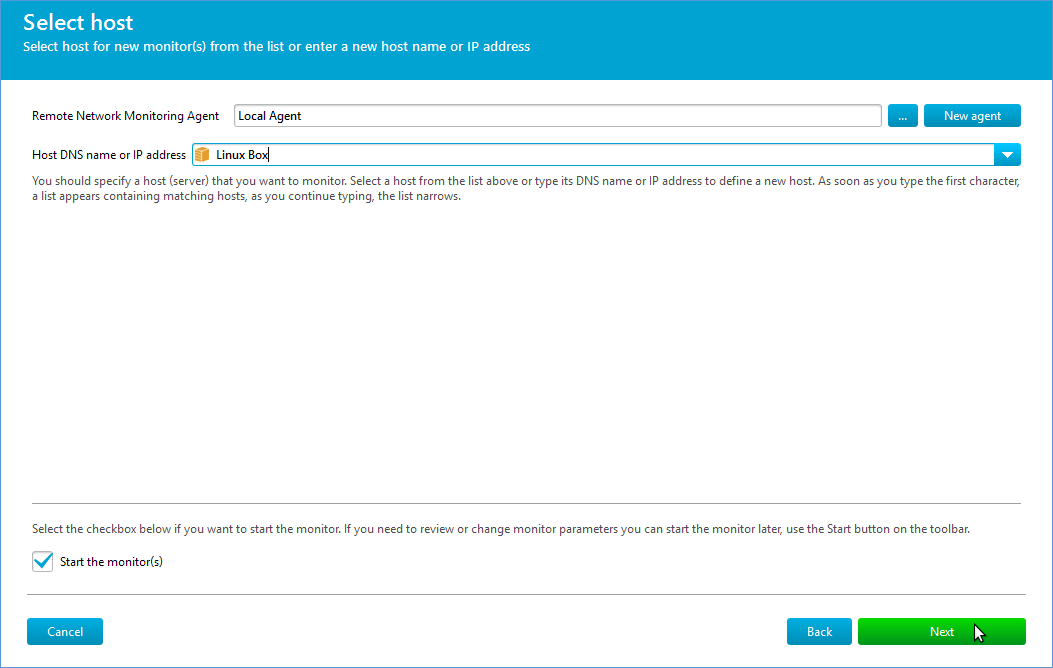 |
| On the final screen, choose the OID, upload MIBs, configure thresholds, and set other parameters (explained below). Note: IPNetwork Monitor is unavailable while the wizard runs. Click “Finish” when done. |  |
Configuring Monitoring Parameters
| Open the MIB browser (see instructions above).
Without the correct MIB file (IP-MIB or rfc1213), the browser will display limited information. Download the MIB, click “MIBs,” and check if it’s loaded. |
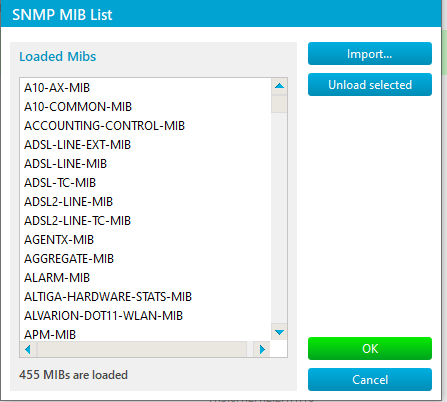 |
| If the MIB isn’t listed, place it in %ProgramData%\IPNetwork Monitor\mibs and click “Import.” Select the file and click “Open.” |  |
| Refresh the browser view. To locate interface admin status OIDs, type “Admin” in the “Find” field. This filters results to matching entries.
Note: Multiple interfaces may exist. We select the first ifAdminStatus entry. Refer to other IF-MIB entries to verify the correct interface. You can monitor other entries too; all key interface entries should be monitored. Select the entry and click “OK.” |
|
| Configure the monitor to trigger alerts for status changes from ‘up.’
Access the State Conditions tab. A warning occurs when the parameter is suboptimal, but not critical. A down state signifies a major issue (interface down). These entries are read/write, enabling interface control via SNMP. Here, ‘testing’ (3) triggers a warning, and ‘down’ (2) signals a serious problem. For more on alerts, see the Alerting and Actions section of our guide. |
 |
Next Steps
| You’ve created an SNMP monitor for interface downtime alerts (note: monitoring the connection interface may prevent alert reception). Now, configure prompt responses. | |
| Adjust the polling interval on the Main parameters tab. A value higher than the default 60 seconds (e.g., 5 minutes) is likely suitable. | 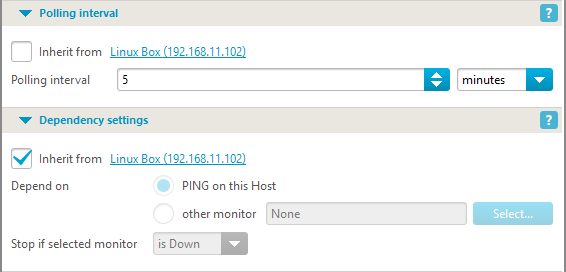 |
| While this example offers limited flexibility, consider using external scripts (see Alerts section) for automatic interface reactivation and/or data collection. | |
| Consult the quick start guide for more information on using SNMP monitors. | |